9450 SW Gemini Drive #32865
Beaverton, Oregon, 97008-7105
In my previous article The Role of Big Data in Machine Learning, I explain that the growing volume of diverse data that organizations now collect and store has been a driving force behind the development of machine learning. However, big data presents us not only with big opportunities in the world of machine learning; it also poses big problems in terms of capturing, storing, managing, and processing enormous volumes of data.
The problem that many organizations are having with big data is that their on-premises data warehouses simply cannot handle the volume, variety, and velocity of data being generated. The on-premises warehouses may also lack sufficient storage and processing power to generate reports or extract business intelligence from that data on a timely basis. Soon after an organization upgrades its on-premises data warehouse, it’s likely to outgrow that warehouse, and replacing a data warehouse is an expensive and time-consuming operation.
To delay the inevitable need to upgrade their data warehouse, many organizations will run reports at the end of the day, so they will be done the next morning or afternoon. In other organizations, where numerous employees frequently query the same data at the same time, they have to wait hours for results, and if the system crashes or freezes during the process, due to its lack of processing capacity, they have to start over. Many of these organizations rely on reporting in near real time to remain competitive.
The problem is growing. According to one estimate, within the next decade there will be more than 150 billion networked sensors in the world, each of which will be generating data 24/7 365 days a year. And just imagine all the data that humans generate in a single day on Facebook, Twitter, Google, online shopping sites, online gaming sites, and more.
To overcome the limitations of on-premises data warehousing solutions, more and more organizations are moving their data warehouses to the cloud — a vast network of storage and processing resources that are available via the Internet.
A cloud-based data warehouse offers the following advantages:
As you explore the topic of data warehousing, you will also encounter the term "data lake," and probably wonder what the difference is. Actually, there are several differences between a data warehouse and a data lake, including the following:
Organizations typically use data lakes when they need to include external data sources in their analyses.
Big data is valuable when applied to two closely related areas:
The takeaway here is that big data is both a problem and an opportunity: It’s a problem in terms of capturing, storing, and processing all that data; but it provides unlimited opportunities in terms of analyzing that data to obtain valuable business intelligence and using that data to facilitate machine learning.
Cloud-based data warehousing helps to solve the problem of big data by providing organizations with access to unlimited storage and compute resources that can be scaled up or down on demand. This powerful combination of cloud-based data warehousing, business intelligence, and machine learning currently serves as a key driver to both innovation and growth.
Fueling the rise of machine learning and deep learning is the availability of massive amounts of data, often referred to as big data. If you wanted to create an AI program to identify pictures of cats, you could access millions of cat images online. The same is true, or more true, of other types of data. Various organizations have access to vast amounts of data, including charge card transactions, user behaviors on websites, data from online games, published medical studies, satellite images, online maps, census reports, voter records, economic data and machine-generated data (from machines equipped with sensors that report the status of their operation and any problems they detect). So what is the relationship between AI and big data?
This treasure trove of data has given machine learning a huge advantage over symbolic systems. Having a neural network chew on gigabytes of data and report on it is much easier and quicker than having an expert identify and input patterns and reasoning schemas to enable the computer to deliver accurate responses.
In some ways the evolution of machine learning is similar to how online search engines evolved. Early on, users would consult website directories such as Yahoo! to find what they were looking for — directories that were created and maintained by humans. Website owners would submit their sites to Yahoo! and suggest the categories in which to place them. Yahoo! personnel would then vet the sites and add them to the directory or deny the request. The process was time-consuming and labor-intensive, but it worked well when the web had relatively few websites. When the thousands of websites proliferated into millions and then crossed the one billion threshold, the system broke down fairly quickly. Human beings couldn’t work quickly enough to keep the Yahoo! directories current.
In the mid-1990s Yahoo! partnered with a smaller company called Google that had developed a search engine to locate and categorize web pages. Google’s first search engine examined backlinks (pages that linked to a given page) to determine the relevance and authority of the given page and rank it accordingly in its search results. Since then, Google has developed additional algorithms to determine a page’s rank (or relevance); for example, the more users who enter the same search phrase and click the same link, the higher the ranking that page receives. This approach is similar to the way neurons in an artificial neural network strengthen their connections.
The fact that Google is one of the companies most enthusiastic about AI is no coincidence. The entire business has been built on using machines to interpret massive amounts of data. Rosenblatt's preceptrons could look through only a couple grainy images. Now we have processors that are at least a million times faster sorting through massive amounts of data to find content that’s most likely to be relevant to whatever a user searches for.
Deep learning architecture adds even more power, enabling machines to identify patterns in data that just a few decades ago would have been nearly imperceptible. With more layers in the neural network, it can perceive details that would go unnoticed by most humans. These deep learning artificial networks look at so much data and create so many new connections that it’s not even clear how these programs discover the patterns.
A deep learning neural network is like a black box swirling together computation and data to determine what it means to be a cat. No human knows how the network arrives at its decision. Is it the whiskers? Is it the ears? Or is it something about all cats that we humans are unable to see? In a sense, the deep learning network creates its own model for what it means to be a cat, a model that as of right now humans can only copy or read, but not understand or interpret.
In 2012, Google’s DeepMind project did just that. Developers fed 10 million random images from YouTube videos into a network that had over 1 billion neural connections running on 16,000 processors. They didn’t label any of the data. So the network didn’t know what it meant to be a cat, human or a car. Instead the network just looked through the images and came up with its own clusters. It found that many of the videos contained a very similar cluster. To the network this cluster looked like this.

A “cat” from “Building high-level features using large scale unsupervised learning”
Now as a human you might recognize this as the face of a cat. To the neural network this was just a very common something that it saw in many of the videos. In a sense it invented its own interpretation of a cat. A human might go through and tell the network that this is a cat, but this isn’t necessary for the network to find cats in these videos. In fact the network was able to identify a “cat” 74.8% of the time. In a nod to Alan Turing, the Cato Institute’s Julian Sanchez called this the “Purring Test.”
If you decide to start working with AI, accept the fact that your network might be sensing things that humans are unable to perceive. Artificial intelligence is not the same as human intelligence, and even though we may reach the same conclusions, we’re definitely not going through the same process.
Think about the last time you heard someone admit to being wrong about something important and personal — not wrong about something insignificant, such as the scheduled time for an event, but rather wrong about a passionate belief or an ingrained personality trait. Can you think of any? If you can’t, that’s okay — these occurrences are rare. A person's identity is strongly associated with his or her personality and beliefs. Admitting to a fault or flaw in these areas is a challenge to the person's identity — not quite the person's existence but certainly his or her essence.
In an organization, leaders are often unwilling to admit their errors or uncertainties, because they are afraid that by doing so they will be perceived as weak or indecisive. If you follow politics, you can witness this phenomenon on both sides of the aisle — politicians who make decisions and embrace certain positions not because they believe it is best but because they are afraid of being perceived as weak or uncertain. They even go so far as to spin the facts to support their respective positions.
A University of California physicist named Richard Muller spent years arguing against global climate change. He helped found the group Berkeley Earth. Much of his work was funded by the gas and oil industry. Later, his own research found very strong evidence of global temperature increases associated with human activity. He concluded that he was wrong. Humans were to blame for climate change. Muller saw that the facts against is belief were too strong to ignore, so he changed his mind. He didn’t do it in a quiet way. He wrote a long op-ed piece in the New York Times that outlined his arguments and why the counter arguments were stronger.
The most effective leaders are actually those who are strong enough to admit when they are wrong. They are rational and make decisions based on information rather than opinion. They do not get defensive when challenged with facts that counter their assumptions.
Challenging someone else's beliefs or assumptions is relatively easy compared to challenging one's own. The distinction can be attributed to two types of critical thinking:
There is no shortage of people who primarily engage in weak-sense critical thinking. They are the people who strongly defend their own positions and equally strongly attack the opposition. They're not very good at challenging their own positions or recognizing any merit in opposing positions. When losing an argument, they get defensive and emotional and often irrational because they so closely identify with the position they hold.
Strong-sense critical thinkers are rare. They are the people who, when confronted with information or opinions that contradict their beliefs or assumptions, are willing to listen to and explore other possibilities. They ask themselves, "Could I be wrong about this?" and "What if I am wrong about this?" They look at the facts, question their own assumptions, and pick apart the logic of their own reasoning. They are committed to the truth. These are the people you want on your data science team.
Imagine how different levels of data critical thinking might play out on a data science team. Suppose a running shoe website runs a promotion and sends out a coupon to everyone who buys a product. The data science team looks at the number of people who used the coupon to make a purchase, and the team produces the data visualizations shown below.
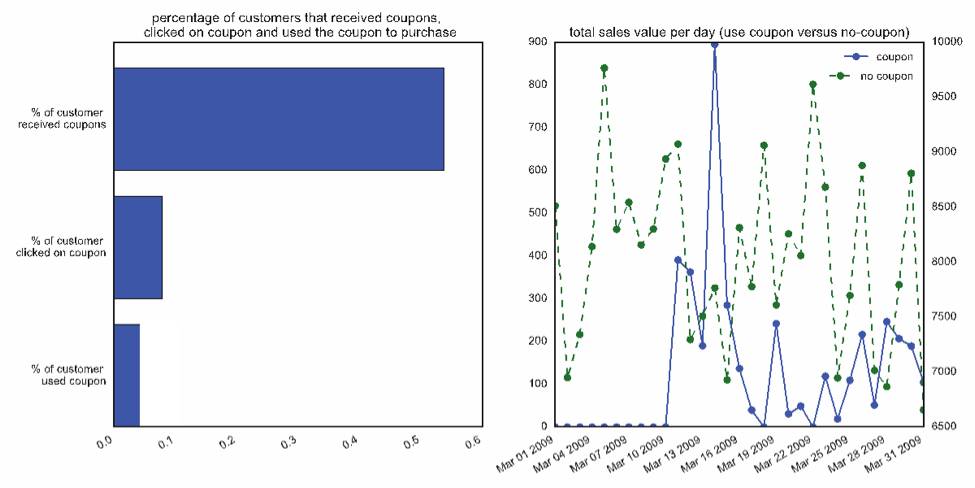
The graph on the left shows that more than half the customers received coupons, only about eight percent clicked on the coupon, and only about half of those people used the coupon.
The graph on the right compares coupon and no-coupon sales. Notice a few spikes in coupon sales primarily the day the coupon was issued and a few days afterward. Also notice that the coupon seems to have increased both coupon and non-coupon sales, but coupon sales account for a relatively small percentage (about 10 percent) of the total sales.
Your data science team wants to determine how successful the coupon was in increasing revenue. Of course, the team could simply look at total revenue in the 14 days prior to the coupon release and revenue in the 14 days after its release and compare the two numbers. However, that would shed light only on whether the coupon was effective and to what degree. It wouldn't explain why the coupon was effective or whether other, less costly, promotions would have been just as effective if not more so.
This is where strong-sense critical thinking comes into play. The data science team should be willing and able to ask more probing questions, such as the following:
When your team applies strong-sense critical thinking, it should feel more like an open discussion. No one should feel as though they’re defending themselves. This approach is a great way for your team to ask interesting questions and in the end, gain greater insights.
Software developers have a popular saying, “Garbage in, garbage out.” They even have an acronym for it: GIGO. What is true for computer science is true for data science, as well, and perhaps even more so — if the data you’re analyzing is false, misleading, out of date, irrelevant, or insufficient, any decision based on that data is likely to be a poor decision.
The challenge of GIGO is compounded by the fact that data volume is growing exponentially. Big data is certainly valuable, but big data is accompanied by big garbage — inaccurate or irrelevant data that can contaminate the pools of data being analyzed. Big garbage creates a lot of “noise” that can result in misleading information and projections.
In this article, I discuss various ways to prevent big data from becoming big garbage.
More isn’t necessarily better when it comes to data. While you can’t always determine ahead of time which data is relevant and which isn’t, try to be selective when choosing data sets for analysis. Focus on key data. Including excess data is likely to cloud the analytics in addition to increasing demand on potentially limited resources, such as storage and compute.
Data warehouses tend to become cluttered with old data that may no longer be relevant. Your data team must decide whether to keep all the data or delete some of it. That decision isn’t always easy. Some analysts argue that storage (especially cloud storage) is inexpensive and that you never know when a volume of historical data will come in handy, so retaining all data is the best approach. Besides, buying more storage is probably cheaper and less aggravating than engaging in tiresome data retention meetings. Others argue that large volumes of data push the limits of the data warehouse and increase the chances of irrelevant data producing misleading reports, so deleting old data makes the most sense.
The only right decision regarding whether to retain or delete old data is the one that’s best for the organization and its business intelligence needs. You can always archive old data that isn’t likely to be useful and then delete it if nobody has used it in the past couple years. Whatever you choose to do with old data, you should have a strategy in place.
Many companies collect as much data as possible out of fear that they will fail to capture data that is later deemed essential. These companies often end up with unmanageable systems in which the integrity and hence the reliability of the data suffers.
I once worked for a company that fell into this common trap. They owned a website that connected potential car buyers with automobile dealerships. They created a tagging system that recorded all activity on the website. Whenever a customer pointed at or clicked on something, opened a new page, closed a page, or acted in any other way, the site recorded the event.
The system grew into thousands of tags. Each of these tags recorded millions of transactions. Only a few people in the company understood what each tag represented. They could tell the number of times someone interacted with a tagged object, but only a few people could figure out from the tag which object it was or how it related to the person who interacted with it.
They used the same tagging system for advertisements and videos posted on the site. They wanted to connect the tag to the image and the transaction, which allowed them to see the image that the customer clicked as well as data from the tag that indicated where the image was located on the page. All of this information was stored in an expanding Hadoop cluster. Unfortunately, the advertisements constantly changed, and the people in charge of tagging items started renaming the tags, so the integrity of the data being captured suffered.
The problem wasn’t that the organization was capturing too little or too much data but that it had no system in place for organizing and understanding that data.
To prevent big data from becoming big garbage, the most important precaution is to be sure that the data team is making conscious decisions and acting with intent. You don’t want a data policy that changes every few months. Decide in advance what you want to capture and save — what data is essential for the organization to achieve its business intelligence goals. Work with the team to make sure everyone agrees with and understands the policy. If you don’t have a set policy, you may corrupt all the data or just enough of it to destroy its integrity, and unreliable data can be worse than having no data at all.
When organizations capture and analyze big data to extract knowledge and insight from it, they often must aggregate three types of data:
In this article, I highlight the differences among these three data types.
Comprising about 10 percent of all available data, structured data is typically stored in a relational database consisting of interrelated tables. Every record has a unique identifier (a primary key), and every data entry is “labeled” with a field name to simplify the process of using and managing the data. Structured data is like the bricks and mortar of the database world. It’s cheap, inflexible, and requires a lot of upfront development.
A good example of structured data is a typical office spreadsheet. When you fill rows with data, you have to stick to a pretty rigid format and structure. For example, suppose you have a column called “Purchase Date.” Each entry in that column must be in a specific format. You can’t have “Tuesday” as one entry and “March” as another. For a purchase date, you want to specify the day, month, and year, and you want all the entries to be consistent. One way to ensure consistency is to create a rule that every entry in the Purchase Date column must be in the MM/DD/YYYY format.
Without a consistent format, you would have a difficult time extracting specific data and using it to create a report, for example. Imagine trying to create a sales report for a certain date range if some dates were spelled out (such as February 2, 2019) while others were numerical (such as 03/29/2020) and some were abbreviated (such as Jan 23, 2020). Any query used to extract date information would need to cover all the variations in the date format.
Most data that an organization generates and uses internally is transaction data, which can be highly structured. Sources of structured data include the following:
With structured data, you have all your data neatly arranged in a relational database, where everything is labeled and organized. You know where everything is, and you know exactly where to find it. It’s like storing spices in labeled jars arranged alphabetically in a spice rack. You know where everything is and you know exactly where to find it.
Semi-structured data contains tags or other markers to “label” data entries without forcing the data into a strict structure such as a table. Semi-structured data is typically stored in a text file that includes metadata— the tags or markers that identify or provide additional information about the data entries. Files that include semi-structured data are commonly saved in one of the following formats, which are generally easy for humans to read and understand:
Sources of semi-structured data include the following:
The most common type of data is everything that isn’t structured or semi-structured: it is unstructured data. Some analysts estimate that 80 percent of all data is unstructured. When you think about it, this makes a lot of sense. Think about the data you encounter every day:
What does all this data have in common? Not much, and that’s part of the problem. None of this data is structured in any uniform way. The data contained in these files are not arranged in tables or entered into specific fields. The content may or may not be tagged to describe what it contains. Even the file formats differ. If you had a dozen documents you couldn’t open, you’d struggle to figure out what was in each one. The challenge would be even greater if you needed to extract details from the documents and aggregate relevant data.
Fortunately, companies such as Google have been working for years to overcome these limitations. Every time you search Google, Bing, or Yahoo!, you reap the fruits of their labor. Whenever search for something on these sites, you’re presented with a long list of links to a variety of content, including web pages, Word documents, PDFs, images, audio, and video. Organizations in diverse industries use many of the same and similar technologies to capture, store, retrieve, aggregate, and analyze unstructured data.
Suppose you own a business that sells running shoes online and you want to identify your best customers. First, you may want to define what you mean by “best customer.” Is your best customer the one who spends the most money in your webstore? Is it the person who suggests ideas for improving your products? Is it the customer who recommends your product the most on social media? Maybe your best customer meets all these criteria.
If your definition of best customer is the person who spends the most in your webstore, all you need is a simple query to your transactional database to rank customers in order from those who spent the most to those who spent the least. For a more sophisticated 360-degree perspective, you could aggregate data from your transactional database, from social media sites such as Facebook and Twitter, and from other sources. Using customer names and email addresses you already have, you can crawl social sites to find out what customers posted about your product — maybe a comment on Facebook or Twitter or a video on YouTube. You can then analyze the aggregated data (structured, semi-structured, and unstructured) to identify patterns that are characteristic of a “best customer.”
As time goes on, you can capture more and more of your customers’ unstructured data, which will allow you to ask more sophisticated questions about your customers. For example, you may want to know which races they run in, so you can sponsor those races. Or you may wonder what other running products they purchase, so you can figure out how to expand your product selection. Answers to each of these questions can help you connect with your customers and sell more products.
As you begin to work with data, realize that all types of data have value, whether structured, semi-structured, or unstructured. Part of your job is to figure out ways to extract value from data regardless of how structured or unstructured that data may be.
So what is a database schema? A schema is a formal description and/or illustration of how data is structured and related in a relational database. The description or illustration includes the following:
When presented as an illustration, a schema is commonly referred to as an entity relationship diagram (ERD).

This very simple ERD shows the relationship of three entities — doctor, patient, and room. Each entity represents a table with several fields. For example, the Doctor entity has the fields ID, First Name, Last Name, and Patient ID. Of these fields, one is the primary key, which is designated “PK” in the diagram. A primary key is a unique identifier. “FK” stands for foreign key, which is a primary key in one table that appears as a field in another table. For example, the Doctor table includes as a foreign key the Patient ID field, which is a primary key in the Patient table.
The lines used to connect the entities define their relationships through the use of the following symbols:

As shown in the ERD above, zero or many patients may be under the care of a single doctor, but only one doctor can be the primary care physician for any given patient. Likewise, zero or many patients may be assigned to a room, but only zero or one room may be occupied by any given patient; for example, a patient may be assigned to a room or allowed to leave the hospital without being assigned to a room.
You can add detail to each table by creating a third column that describes the data type for each field; for example, you could use “number” or “integer” for the ID fields and something like “text (50)” for the First Name and Last Name fields, to indicate that entries must be text and no longer than 50 characters. If you had a table with a Phone Number field, you could use something like “integer (10)” to indicate that the field must contain 10 numerals.
Schemas are important because they set the rules for adding data to the database and facilitate the process of extracting, filtering, sorting, and analyzing data. A schema ensures that every record in the database has a unique identifier (primary key), that all data entries in a particular field are formatted the same way, and that essential data is not omitted. By following a well-constructed schema, you ensure that the data is properly organized, which makes working with that data much easier.
In data science, one of the biggest challenges in managing a data warehouse arises when organizations need to import data from other sources for analysis. The organization has a schema in place to organize its own internal data, but this schema rarely matches the schema used for the data from external sources. For example, one organization may call the Customer ID field “Cust#,” while another calls it “CustID.” In many cases, the data from the external source isn’t from a relational database and, as a result, has no clear schema in place. The challenge is how to import disparate data into the organization’s existing database without ending up with a huge mess.
Database administrators overcome this challenge by performing a process called extract, transform, and load (ETL):
ETL provides the means to combine disparate data from multiple sources and create a homogenous data set that can be analyzed in order to extract business intelligence from it.
Not all databases are relational or carefully structured. Some are considered schema-less, meaning they do not conform to a strict structure and set of rules. For example, data need not be stored in tables or obey specific data type constraints. Schema-less databases offer the following benefits:
Note that schema-less is not the equivalent of unstructured. Schema-less databases store data as key/value or attribute-value pairs (in the case of JavaScript Object Notation (JSON) documents). In other words, although data is not stored in a table, all data entries are “labeled,” so data can be easily extracted, filtered, sorted, combined, and analyzed.
You can’t have a discussion about big data or data science these days without Hadoop basics, but when you ask people what Hadoop is, they struggle to define it. I define Hadoop as a software framework for harnessing the power of distributed, parallel computing to store, process, and analyze large volumes of structured, semi-structured, and unstructured data.
Imagine having to write a 30 chapter book. You have two options — write it yourself or write the one chapter you know the most about and farm out the other 29 chapters to various experts on those topics. Which option would deliver the best book in the least amount of time? Obviously, distributing the work among 30 experts would expedite the process and result in a higher quality product. The same is true with distributed, parallel computing; instead of having one computer do all the work, you distribute tasks to dozens, hundreds, or even thousands of powerful “commodity” servers that perform the work as a collective. This group of servers is often referred to as a Hadoop cluster, and Hadoop coordinates their efforts.
Hadoop has three key features that differentiate it from traditional relational databases, which make it an attractive option for working with big data:
Hadoop has several advantages over traditional relational databases, including the following:
Hadoop certainly helps to overcome many of the challenges of big data, but it is not, in itself, an ideal solution. It is weak in the following areas:
Commercial versions of Hadoop are available to help overcome these and other limitations of the open source Apache Hadoop, including Amazon Web Services Elastic MapReduce, Cloudera, Hortonworks, and IBM InfoSphere BigInsights.
Big data is a term that describes an immense volume of diverse data typically analyzed to identify patterns, trends, and associations. However, the term “big data” didn’t start out that way. In 1997, NASA researchers Michael Cox and David Ellsworth described a “big data problem” they were struggling with. Their supercomputers were performing simulations of airflow around aircraft and generating massive volumes of data that couldn’t be processed or visualized effectively. The data were pushing the limits of their computer storage and processing, which was a problem — a big problem. In this context, the term “big data problem” was used more to describe a big problem than big data; NASA was facing a big, data problem, not so much a big-data problem.
A decade later, a McKinsey report entitled “Big data: The next frontier for innovation, competition, and productivity” reinforced the use of the term “big data” in the context of a problem that “leaders in every sector will have to grapple with.” The authors refer to big data as data that exceeds the capability of commonly used hardware and software.
Over time, defining big data has taken on a life and meaning of its own, beyond the context of a problem, to include the potential value of that data, as well. Now, big data poses both big problems and big opportunities.
Many organizations that start big-data projects don’t actually have big data. They may have a lot of data, but volume is just one criterion. These organizations may also mistakenly think that they have a big-data problem, because of the challenges they face in capturing, storing, and processing their data. However, data doesn’t constitute big data unless it meets the following criteria (also known as the four V’s):
Volume: In the world of big data, volume is no longer measured in megabytes and gigabytes but is now measured in terabytes, petabytes, exabytes, zettabytes, and yottabytes. Imagine the volume of data generated around the world every day by the over six billion smart phone users. Add to that Internet data and machine-generated data from the growing number of devices that comprise the Internet of Things (IoT), along with data from numerous other sources.
An interesting example of a big data problem is the challenge surrounding self-driving cars. To enable a self-driving car to safely navigate from point A to point B without running over pedestrians or crashing into objects, you would need to collect, process, and analyze a heavy stream of diverse data, including audio, video, traffic reports, GPS location data, and more, all flowing into the database in real time and at a high velocity. You would also need to evaluate which data is most reliable; for example, the historical data showing that the left lane is open to traffic, or the live video of a sign telling drivers to merge right. Is that person standing at the corner going to dart out in front of the car or wait for Walk signal? Whether the driver is human or the car is navigated by big data, a split-second decision is often required to prevent a serious accident. A driverless car would have to instantly process the video, audio, and traffic coordinates, and then “decide” what to do. That’s a big data problem.
Technology is evolving to solve most big data problems, and the cloud is playing a key role in this process. The cloud offers virtually unlimited storage and compute, so organizations no longer need to bump up against limitations in their on-premises data warehouses. In addition, business intelligence (BI) software is becoming increasingly sophisticated, enabling organizations to extract value from data without requiring a high level of technical expertise from users.
Still, many organizations struggle with data problems, both big and small. Some continue to struggle to meet storage and compute limitations simply because they are reluctant to move their on-premises data warehouses to the cloud. However, most organizations that struggle with data simply don’t know what to do with the data they have and the vast amounts of diverse data that are now readily available. Their problem with data is that they haven’t developed the culture of curiosity and innovation required to put all the data available to good use. In many ways, this shortcoming in organizations poses the real big data problem.