9450 SW Gemini Drive #32865
Beaverton, Oregon, 97008-7105
The success of any data science initiative hinges on the team's ability to ask interesting questions that are relevant to the organization's success and the team's ability and willingness to challenge assumptions and beliefs. After all, without questions, you can have no answers. However, asking compelling questions and challenging long-held beliefs that have become accepted as facts can be a significant challenge, especially in organizations with strict hierarchies that discourage questioning and the challenging of authority.
If your data science team is struggling to come up with compelling questions and hesitates to challenge assumptions, the suggestions I present in this post can get the ball rolling. Getting started is the most difficult part. As soon as the team gets into the swing of asking questions and questioning beliefs, it will have no shortage of follow-up questions and problems to investigate.
One of the best ways to encourage data science team members to ask questions and challenge beliefs is to build an environment that's conducive to the free exchange of ideas. The research lead is ultimately responsible and can start to nurture the free exchange of ideas by modeling the desired behavior — listening and learning without judging. Everyone on the team should engage in deep listening— focused listening that enables them to hear and understand what others are saying, ignoring any initial impulse to judge what they hear. Team members need to recognize that they have plenty of time later to analyze what they hear, but the first step is to fully understand what the other person is getting at.
A good way to encourage questions and reinforce deep listening is to conduct question meetings. In these meetings, the research lead should encourage participants to ask questions before making statements. This techniques is sometimes called a "question first" approach. These meetings are about eliciting the maximum number of questions. They’re focused on everyone asking their questions and listening. Ban smartphones, laptops, and other electronic devices from these meetings. Everyone should focus on listening, although you may want to assign one person in the meeting the task of taking notes.
Although question meetings are mostly unstructured, consider starting the meeting like this:
Avoid quick statements that are likely to limit the scope of the discussion, such as "The CEO suspects that we are losing market share due to the recent reorganization of our marketing department." Such statements keep people from coming up with their best ideas. Remember that it’s the discussion that gives your team the greatest value. You want the team to consider all possibilities.
After a question meeting, you should have plenty of questions — far more than you need and some far more valuable than others. Now it's time to pan for gold — to identify the few questions you want your team to explore.
When evaluating questions, it often helps to categorize questions as open- or close-ended and then identify individual questions as essential or non-essential:
If you’re the research lead, make sure that the team is not asking too many of any one type of question. Too many open-ended questions can result in the team spending too much time wondering and not enough time exploring the data. Too many close-ended questions can result in too much time digging up facts and too little time looking at the big picture.
You can also categorize questions as essential and non-essential:
If you’re a fan of detective shows, you’ve probably seen a crime wall. That’s when a detective tries to figure out all the different pieces of an unsolved mystery. He or she puts up pictures and notes on a wall and tries to connect the different pieces. The board becomes a visual story. That’s why you’ll often see the detective sitting on the floor staring at the board trying to pull together the story from all the little mysteries in the data.
Your data science team will have a similar challenge. They’ll try to tell a story but they’ll only have pieces of the puzzle. Your team can use the same technique to create a question board—a place where they can see all the questions and data. That way they can tell a larger story.
Creating a question board is a great way to display ideas and solicit questions from your team and the rest of the organization. At the very top of the board, you should put a simple identifier such as “question board” or “ask a question.” The question board is a clear way to communicate and organize them in one place.
Your data science team should have dozens or even hundreds of different questions. The question board will likely be a key meeting point for the team as well as a great place for team members and stakeholders to talk about the project.
To start, place your question board next to someone’s desk on the team or in a hallway. Open spaces aren’t good for a question board. You’ll want people to stand next to the board and read the questions. Another suggestion is to put the board next to an area with a lot of traffic. Ideal places are next to the water cooler, snack bar, or bathroom. It should be a place where several team members can meet and not distract other people.
Usually, the best way to organize your board is to use different color sticky notes. You’ll want to organize your board from top to bottom. The sticky notes at the top of the board contain your essential questions. Use red or pink sticky notes for these questions. Below them, you can use yellow sticky notes for nonessential questions. Remember that these are questions that address smaller issues. They are usually closed questions with a correct answer. Finally, you can use white or purple sticky notes for results. These are little data points that the team discovered that might help address the question.
There are five major benefits to having a question board:
Remember that you want your team to have deep discussions. Everyone should be able to question each other’s reasoning. The team should listen to each other’s questions and try to come up with questions of their own. They should be focused on learning and not judging the quality of their questions.
The question board helps with this because it provides a place for people to focus their discussions. It also helps the team stand up and participate physically and come up with new ideas.
Many of your questions will be interconnected. Often, you’ll have essential questions that are connected to several closed, nonessential questions. If it’s on the wall, you can use string to show these connections. If it’s on a whiteboard, you can just draw different colored lines. This will help your team stay organized and even prioritize their highest value questions.
The question board will invite other people outside your team to participate. You might want to leave a stack of green sticky notes next to the board. Leave a marker and a small note that invites other people to add their own questions. Sometimes these questions from outside the team tell the most interesting stories.
Your question board will be a key part of communicating your data science story. It should have the questions that your team is working to address. It may also have little bits of data that suggest some answers. A good question board encourages other people to participate and tempts people to be part of your shared story.
One of the challenges of a question board is to have it filled with questions and keeping it well organized. Since it’s designed for a group discussion, you want everyone to be able to share the same information. It shouldn’t have several different groups of one person’s notes. If each group only has one person’s ideas, that one person will be the only one to understand its meaning.
Instead, all your questions should be organized using the same system. One of the best ways to do this is by creating question trees. A question tree is a group of sticky notes all related to one essential question. You’ll want to have the essential questions as the most attention grabbing color. Usually this is either red or pink.
Let’s imagine a question board for our running shoe website. One question that your team came up with is, “Can our website help encourage non-runners become runners?” If you’re the research lead for the team, you want to put this essential question on a red sticky at the very top of the board.
Underneath that essential question, you can start adding other questions. It could be another essential question such as, “What makes people run?” It could also be a nonessential question like, “Do non-runners shop on our site?” Since this is a closed question, you could put a little data sticky next to the yellow question sticky. Maybe something like, “Data suggest that 65% of our customers don’t run in a given week.” You could use a pie chart like the one shown below to illustrate this point.
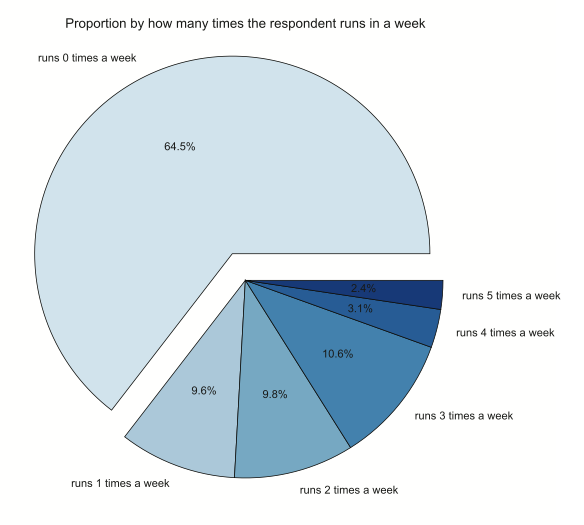
Assume that this generated data comes from a survey that the company did on its customers. The question asked, “How many times, on average, do you run per week?” When you look at the data, you see that about 65% of the respondents don't run at all. 55% of the respondents run more than once per week.
Someone looking at the question tree should be able to follow the thought process of the team. She should see that the lower branches of questions started with one open-ended essential question (“Can our website help encourage non-runners become runners?”) and see the team addressing that question. She should be able to follow it all the way down to different branches.
Let’s say that the question, “What makes people run?”, branches off in its own direction. Underneath that question is another question that says, “Do they run to relieve stress?” Underneath that is another question that says, “Can non-runners who are stressed see the benefits of running?”'
With the question tree, the research lead now has a report to show progress to the rest of the organization. She could show that the data science team is working on several high-value questions simultaneously. It shouldn’t be too difficult to see how gaining insight into creating customers might increase revenue.
The question trees help the research lead connect the team’s work to real business value. A question board should have several questions trees. At the very top of the board, there should be several red or pink essential questions. Each of these should branch down like an upside down tree into several other questions. Be sure to use different color sticky notes as discussed previously (essential questions red or pink and nonessential questions yellow). Sometimes open questions will branch off into different question trees and you should end closed questions with little sticky notes that show the data.
Like any tree you’re going to want to prune your questions. This is one of the key responsibilities of the research lead. She needs to make sure that your questions lead to real business value. If he doesn’t think your questions will lead to insights, he might want to pull them off the question board so the data analyst doesn’t start searching for results.
Note: The research lead usually removes questions as part of the team’s question meetings. You don’t want your research lead pulling questions off the board without communicating the change to the team.
One of the key things about question trees is that they actually mirror how most teams come up with new questions. Remember that data science is using the scientific method to explore your data, which means that most of your data science will be empirical. Your team will ask a few questions, gather the data, and then they will react to that data and ask a series of questions. When you use a question tree, it reflects what the team has learned. At the same time, it shows the rest the organization your progress.
In my two previous posts, "The Data Science Life Cycle" and "Run Data Analytics Sprints," I present a six-stage framework to structure the work a data science team performs and five techniques for performing the work in intense, two-week cycles called data sprints. These techniques go a long way to making the data science team productive.
In this post, I call your attention to several pitfalls that commonly undermine the data science team's efforts, and I provide guidance on how to be proactive in avoiding these pitfalls. Generally, your data science team needs to squash anything that limits their mission to something other than exploration and discovery.
Many organizations create data science teams and then essentially tie their hands, preventing them from truly exploring the data. Much less frequently, organizations provide their data science teams with too much freedom, so the teams end up chasing data and questions that are irrelevant to the organization's success or getting so wrapped up in routine chores, such as managing the data warehouse, that they fail to produce anything of value. In most organizations, though, the problem involves a strict hierarchy that tries to control what the data science team does, and that is a formula for failure.
Prior to installing a data science team, an organization often must change its mindset and values. It must embrace a spirit of creativity and innovation, especially in respect to its data science team. When the team is doing what it should be doing, it is learning and helping the organization learn. It is discovering what the organization doesn’t know. Attempts to micro-manage the team run counter to its mission.
However, the data science team does need to deliver value. It should serve the needs of the organization. Data science teams can achieve that goal by being highly service-oriented and by collaborating with everyone across the organization to get their questions answered, help them overcome any challenges they face, and inform their decisions.
Most organizations still view work as a series of goals and objectives. They invest a great deal of time, money, and effort on planning, management, and compliance. Teams are expected to set goals in advance, formulate plans to meet those goals, execute their plans, and deliver the promised outcomes. While that approach works well for most teams, it is counterproductive for data science teams whose mission it is to explore and innovate. Data science teams need to follow the data and the questions, and they cannot shift direction if their path is carved in stone.
If you're on a data science team, you may feel as though your team is trying to hit a constantly moving target. Every sprint introduces new questions that may lead the team in a different direction. Sometimes, the team may not even know what the moving target is. The team may be looking for patterns in the data that reveal new targets. By working without objectives, the team has the flexibility it needs to let its curiosity and the data determine the outcomes.
Serendipity is a happy happenstance, such as striking up a conversation with the CEO of Microsoft at a Mariners game and having him offer you a job on the spot. It is an odd concept in the world of business, where strategy, goals, objectives, and planning are enshrined as the essential components of success.
However, more and more evidence points to the advantages of serendipity over goal setting and planning. One of the best books on the topic is Why Greatness Cannot Be Planned: The Myth of the Objective, by Ken Stanley and Joel Lehman. According to the authors, “Objectives actually become obstacles towards more exciting achievements, like those involving discovery, creativity, invention, or innovation.”
Data science teams are wise to capitalize on serendipity. For example, if a team member sees something unexpected and intriguing in the data the team is analyzing, the team needs to follow up on that discovery. You don't want your team focused on objectives at the expense of overlooking a groundbreaking discovery. Professor Stanley calls these “stepping-stones” — interesting things that eventually lead to insights. If you ignore them, you are likely to miss key discoveries.
When you're working on a data science team, it's easy to get so caught up in the data, analysis, exploration, and discovery that you lose sight of the organization's needs. Driven by innate curiosity to follow wherever the data leads, the team forgets that others in the organization are relying on it to deliver knowledge and insight that guide strategy and inform decision-making. Every couple weeks, the team delivers its reports or presentations, which the team finds fascinating but which leave everyone else in the organization wondering "So what?" or "Who cares?"
To avoid this pitfall, the data science team must engage, to some degree, in guided exploration. Three tools in particular are helpful for structuring and guiding the data team's work:
By its very nature, routine is repetitive, and it can become hypnotic, lulling you into a complacency that prevents you from noticing the wonderful world that surrounds you. The same is true for a data science team. It can become so wrapped up in capturing, cleaning, and consolidating data and creating data visualizations that it loses its sense of adventure. It falls into a rut and stops asking interesting questions. When looking at the data, it may not even notice an intriguing fact that's staring right back at them.
To avoid this pitfall, try the following techniques:
Keep in mind that your data science team should be committed to exploration, discovery, and innovation that's relevant to the organization's needs. If the team works toward achieving that mission, it will be less susceptible to the most common pitfalls.
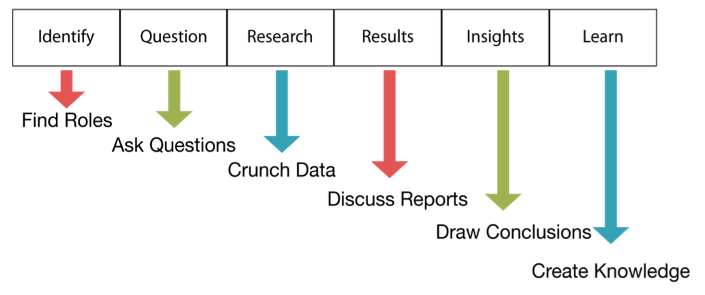
In my previous post, "The Data Science Life Cycle (DSLC)," I encourage you to adopt a structure for your data team's activities that is conducive to the type of work it does — exploration. I refer to this structure as the Data Science Life Cycle (DSLC), illustrated below.
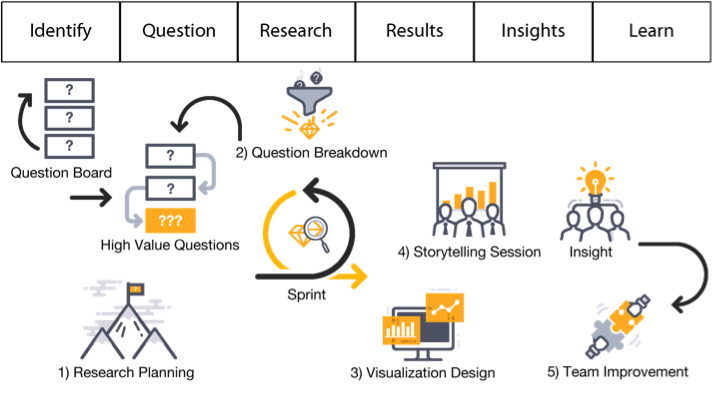
At first glance, DSLC appears to be a linear process, starting with identification and ending with learning, but the process is actually cyclical. Learning leads to more questions that return the team to the beginning of the process. In addition, mini-cycles often form within the DSLC as research and analysis results prompt questions that require additional research and analysis to answer, as shown below.

In this post, I drill down to illustrate how data science teams can function more effectively and efficiently within the DSLC framework by employing the following techniques:
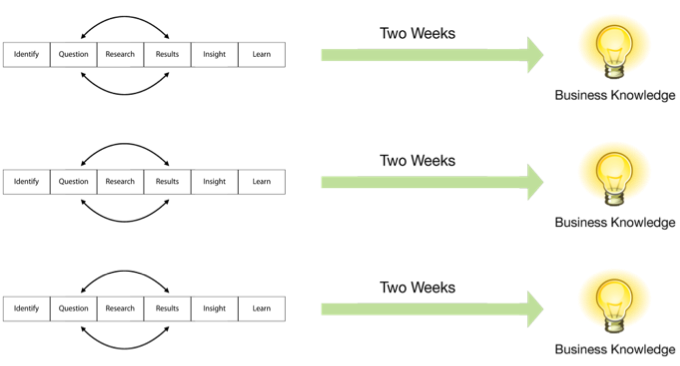
The DSLC isn’t designed to cycle over a long period of time. Two weeks is sufficient for a cycle (a sprint). That gives the team sufficient time to prepare and analyze the data and compose a story that reveals the knowledge and insight extracted from the data and its significance to the organization. With short cycles, if a specific line of enquiry proves fruitless, the team can change course and head in a different direction or tackle a new challenge.
You may have heard of sprints in the context of agile software development methodologies, such as Scrum, but the term actually originated in product development. A sprint is a consistent, fixed period of time during which the team runs through an entire lifecycle. Each sprint should run through all six stages of the DSLC, as shown below.
As I explained in an earlier post, "Data Science Team Roles," teams should be small (four to five individuals) and include a research lead, data analyst, and project manager. Although every member of the team should be asking compelling questions, the research lead is primarily responsible for that task.
One of the most effective ways to inspire and share interesting questions is via a question board— usually a large whiteboard positioned near the data science team on which team members and others in the organization post questions or challenges. The board should have plenty of open space with a short stack of sticky notes in one of the corners. You may want to include a large arrow pointing down to the stack of sticky notes with the caption, “Ask a question.”
The question board should be open to everyone in the organization, including the research lead, other data science team members, executives, managers, and employees. Try to make your question board look as enticing as possible. Anyone in the organization should be able to walk by, grab a sticky note, and post a quick question.
Given only two weeks to complete each sprint, your data science team should limit the amount of time it spends in meetings and keep those meetings focused on a specific purpose. I recommend that teams conduct five meetings over the course of a two-week sprint, each with a specific purpose and a time limit that the team agrees upon in advance:
Breaking down your work involves allocating a sufficient time to all six stages of the DSLC. What often happens is that data science teams get caught up in the research stage — specifically in the process of capturing, cleaning, and consolidating the data in preparation for analysis. Given only two weeks per sprint to deliver a story, the data science team has little time to prep the data. Like agile software development teams, the data science team should look to create a minimally viable product (MVP) during its sprint — in the respect to data science, this would be a minimally viable data set, just enough data to get the job done.
Remember, at the end of a sprint, stakeholders in the organization will want to know "What do we know now that we didn't know before?" If your team gets caught up in data prep, it won't be able to answer that question.
Organizations that make significant investments in any initiative want to see a return on investment (ROI), typically in the form of a deliverable. In the world of data science, the deliverable is typically in the form of an interesting story that reveals both the meaning and the significance of the team's discoveries. Unlike a presentation or data visualization, which merely conveys what the team sees, a story conveys what the team believes. A good story provides context for understanding the data, along with guidance on how that understanding can benefit the organization.
An effective story accomplishes the following goals:
A project lifecycle can be a useful tool for structuring the process that a team follows. (A lifecycle is a repeating series of steps taken to develop a product, solve a problem, or engage in continuous improvement.) It functions as a high-level map to keep teams moving in the right direction. Although data science teams are less goal-oriented than more traditional teams, they too can benefit from the direction provided by a project lifecycle. However, traditional project lifecycles are not conducive to the work of data science teams.
In this post, I discuss two more traditional project lifecycles and explain why they are a poor fit for data science "projects." I then present a data science life cycle that is more conducive to the exploratory nature of data science.
The software development lifecycle (SDLC) has six phases as shown below. Under each phase is an example of an activity that occurs during that phase. This is typically called the waterfall model because each one of these phases has to be complete before the next can begin.
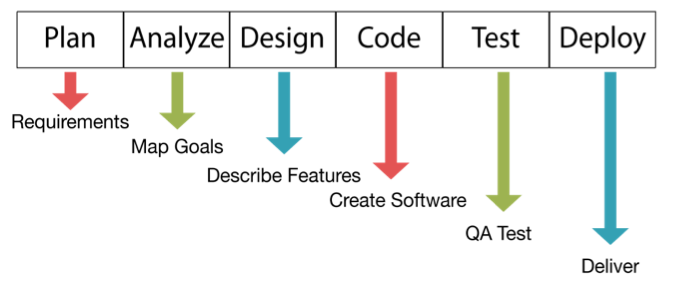
SDLC works well for software development because these projects have a clearly defined scope (requirements), a relatively linear process, and a tangible deliverable — the software. However, this same lifecycle is poorly suited for data science, which has a very broad scope, a creative and often chaotic process, and a relatively intangible deliverable — knowledge and insight.
The Cross Industry Standard Process for Data Mining (CRISP-DM) lifecycle, which is used for data instead of software, is considerably more flexible than the waterfall model. It also has six phases, as shown below. The various phases aren't necessarily sequential, and the process continues after deployment, because learning sparks more questions that require further analysis.
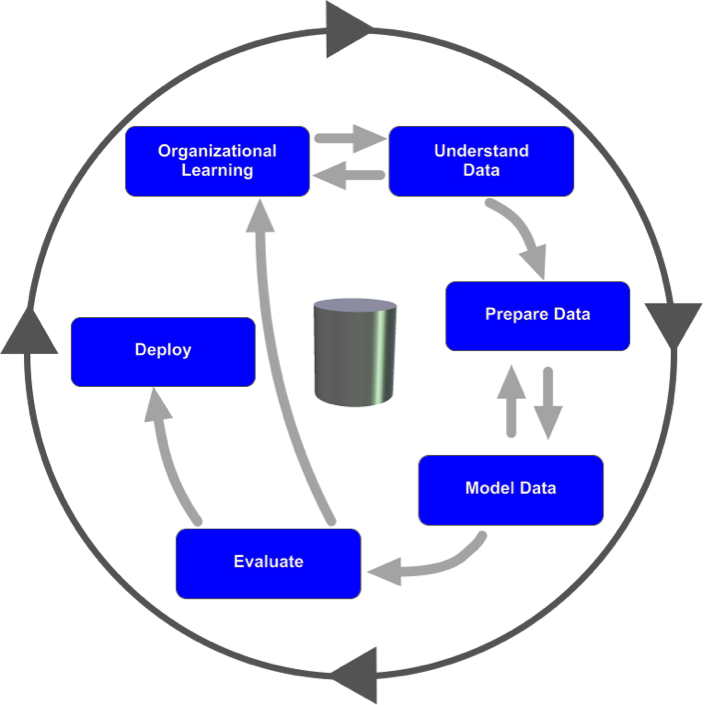
CRISP-DM works much better for data science than does SDLC, but, like SDLC, it is still designed for big-bang delivery — deployment. With either model, the data science team is expected to spend considerable time in the early stages — planning and analyzing (for software development) or organizational understanding (for data mining). The goal is to gather as much information as possible at the start. The team is then expected to deliver the goods at the end.
For a data science team to be flexible and exploratory, they can't be forced to adopt a standard lifecycle. A more lightweight approach is necessary to provide the structure necessary while allowing the team to be flexible and shift direction when appropriate.
The fact that traditional project lifecycles are not a good match for data science doesn't mean that data science teams should have complete operational freedom. These life cycles are valuable for structuring the team's activities. With a general sense of the path forward, the team at least has a starting point and some procedures to follow. A good lifecycle is like a handrail; it's there to provide support, but it's not something you need to cling to.
The approach that seems to work best for data science teams is the data science life cycle (DSLC), as shown below. This process framework, based loosely on the scientific method, is lightweight and less rigid than SDLC and CRISP-DM.
Like the two project life cycles presented earlier in this post, DSLC consists of six stages:
DSLC isn't always or even usually a linear, step-by-step process. The data science team should cycle through the questions, research, and results, as shown below, whenever necessary to gain clarity.
Some organizations that have strong data science teams already follow this approach. For example, the video subscription service Netflix used this approach to create their hit series “House of Cards.” They had 33 million subscribers at the time. Their data science team looked at what customers were watching, ratings of shows, what plots viewers liked, and the popular actors (Kevin Spacey was very popular at the time). Netflix determined that political shows were very popular and hired Spacey. Then they modeled the new show on the popular British version of the program.
The Netflix team used data science to develop the idea for the show. They created a predictive model based on analysis of viewer demand. They worked to cycle through questions, research, and results. They then created a story of what their customers would like to see. That story became an actual story that turned into a hit television program.
This cycle of question, research, and results drives insights and knowledge. The data science team loops through these areas as part of the larger DSLC. Remember to not think of this lifecycle as a waterfall process. Instead, think of it as a few steps to start and then a cycle in the middle to churn out great stories at the end.