9450 SW Gemini Drive #32865
Beaverton, Oregon, 97008-7105
As I explained in a previous article, “Building a Data Science Team,” a data science team should consist of three to five members, including the following:
Together, the members of the data science team engage in a cyclical step-by-step process that generally goes like this:
Data science teams also commonly run experiments on data to enhance their learning. This will help the team collaborate on many data-driven projects.
Experiments generally comply with the scientific method:
Suppose your data science team works for an online magazine. At the end of each story posted on the site is a link that allows readers to share the article. The data analyst on the team ranks the stories from most shared to least shared and presents the following report to the team for discussion.
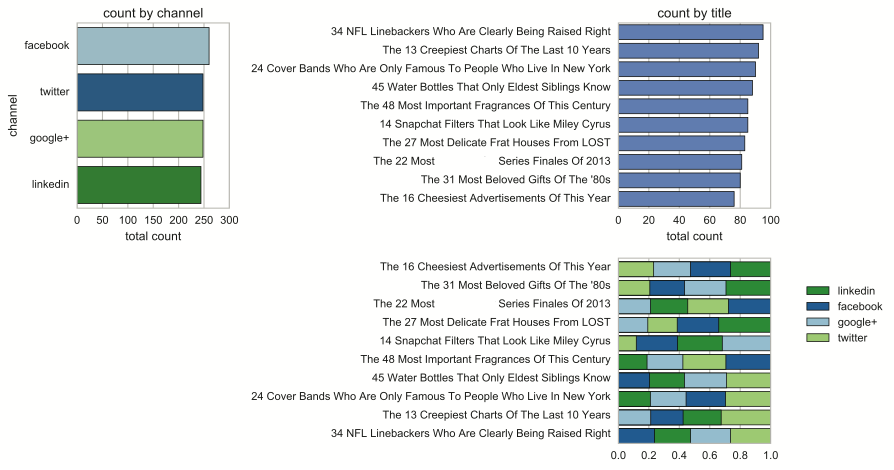
The research lead asks, “What makes the top-ranked articles so popular? Are articles on certain topics more likely to be shared? Do certain key phrases trigger sharing? Are longer or shorter articles more likely to be shared?”
Your team works together to create a model that reveals correlations between the number of shares and a number of variables, including the following:
The research lead is critical here because she knows most about the business. She may know that certain writers are more popular than others or that the magazine receives more positive feedback when it publishes on certain topics. She may also be best at coming up with key words and phrases to include in the correlation analysis; for example, certain key words and phrases, such as “sneak peek,” “insider,” or “whisper” may suggest an article about rumors in the industry that readers tend to find compelling. This will create a visualization that can communicate even big data to people without a data skill set.
Based on the results, the analyst develops a predictive analytics model to be used to forecast the number of shares for any new articles. He tests the model on a subset of previous articles, tweaks it, tests it again, and continues this process until the model produces accurate “forecasts” on past articles.
At this point, the project manager steps in to communicate the team’s findings and make the model available to the organization’s editors, so it can be used to evaluate future article submissions. She may even recommend the model to the marketing department to use as a tool for determining how to charge for advertising placements — perhaps the magazine can charge more for ads that are positioned alongside articles that are more likely to be shared by readers.
Although you generally want to keep your data science team small, you also want people on the team who approach projects with different perspectives and have diverse opinions. Depending on the project, consider adding people to the team temporarily from different parts of the organization. If you run your team solely with data scientists, you’re likely to lack a significant diversity of opinion. Team member backgrounds and training will be too similar. They’ll be more likely to quickly come to consensus and sing in a chorus of monotones.
I once worked with a graduate school that was trying to increase its graduation rate by looking at past data. The best idea came from a project manager who was an avid scuba diver. He looked at the demographic data and suggested that a buddy system (a common safety precaution in the world of scuba diving) might have a positive impact. No one could have planned his insight. It came from his life experience.
This form of creative discovery is much more common than most organizations realize. In fact, a report from the patent office suggests that almost half of all discoveries are the result of simple serendipity. The team was looking to solve one problem and then someone’s insight or experience led in an entirely new direction.
In a previous post, “Data Analytics Questions," I stress the importance of asking compelling questions when serving as a member on a data science team. After all, questions are the impetus for exploration and discovery. In that post and a subsequent post, "Three Places to Look for Better Data Questions," I recommend several techniques initiating question sessions.
However, the techniques I recommend aren't helpful unless you and others on your data science team are comfortable asking questions. In this post, I present four common reasons that data science team members may be uncomfortable asking questions. Simply by recognizing the common barriers to asking questions, you are better equipped to overcome those barriers on your own.
Asking questions may be very uncomfortable, especially when you're asking someone who's in a position of authority and especially when the person you're asking has an intimidating presence. After all, your question may be perceived as being dumb or as challenging or threatening the other person. No doubt about it — some people have even been fired over asking very good questions.
As a result, many employees, even those who serve on a data science team, may be reluctant to ask compelling questions. They have a natural desire to protect themselves. Nobody wants to seem dumb, wrong, or confrontational.
Overcoming this barrier requires working up the courage to ask compelling questions. Sometimes, you just need to do it — force yourself. If you can't work up the courage, try the opposite tactic — fear. Remind yourself that your job is to ask good questions. If you don't ask, you're not doing your job. And if you don't do your job, your team will fail, and you'll all end up in the unemployment line.
The good news is that over time and with lots of practice, asking tough questions becomes second-nature. When you begin to see that asking questions isn't a threat, and you begin to reap the benefits of asking good questions, any fear you may have had quickly disappears.
Some data science teams just don't have enough time and energy to ask compelling questions. Asking questions is hard work; it's exhausting, especially when you're just getting started on a project. It might seem as though each question meeting gets longer. Instead of feeling as though you're making progress toward an answer or solution, you may feel as though you're getting further and further from it. At this point, the team can quickly become discouraged and stop asking.
Many data science teams fall into this trap, and as soon as they stop asking questions, they turn their attention to routine work, such as capturing and cleaning data or implementing new data analytics and visualization tools.
Often, the rest of the organization celebrates this shift from what's perceived as esoteric to more practical endeavors — real work. Many organizations prefer a busy team over an effective one. When this happens, everyone gets so focused on rowing that no one takes the time to question where the ship is headed and why.
Remember that there is no prize for the most data, the cleanest data set, or the best data analytics and visualizations. Prizes are given out for delivering insights and creating business value. You can't do that unless you spend quality time coming up with compelling and relevant questions.
Some data science teams struggle to ask questions simply because they have little experience doing so. This is especially prevalent when team members are engineers, software developers, or project managers — people who have built their careers on answering questions and solving problems. These people want to do, not ask. Team members who come from science or academia tend to have an easier time making the transition.
Nothing is wrong with answers and solutions. In fact, a data science team often needs its members to propose answers and solutions, so those can be tested. However, during question sessions, the team needs to find a way to transform some statements into questions. For example, a team member who is unaccustomed to asking questions may say something like, "I see that more women than men are buying running shoes on our website. Maybe it's because our marketing department caters mostly to women.” The team could easily convert those statements into a question: "Why do more women than men buy running shoes on our website?"
Remember: statements don't spark discussion. Usually, the only option is for the other person to agree or disagree. With a question, the team can begin to consider a range of possibilities and discuss the data it needs to examine for answers.
Some data science teams are stifled by a corporate culture that discourages employees from asking questions. In his book The Magic of Dialogue: Transforming Conflict into Cooperation, social scientist Daniel Yankelovich points out that most organizations in the U.S. have a culture of action. When they encounter a problem, their first instinct is to fix what's broken. Asking questions impedes progress.
Quick, decisive action is often needed in organizations, but it's counterproductive in data science, where the focus is on learning and innovation. One thing you don’t want to see the data science team doing is getting wrapped up in routine work to accomplish something practical. You don’t want the research lead saying something like, “You can ask questions once you finish uploading all the data to the cluster.” The team shouldn't be focused on completing projects but on coming up with new insights.
When you’re working on a data science team, watch out for an individual or organizational bias against questions. Questioning is one of the first steps toward discovery. If you skip this step, your team, and the organization overall, will have trouble learning anything new.
Data drives the data science team's exploration and discovery, so the team must be on the constant lookout for bad data, which can lead the team astray or result in erroneous conclusions. In this post, I present several ways to challenge the data science evidence the team is provided to ensure that the team is working with accurate information and to generate addition questions that may lead to valuable discoveries.
Many organizations rely on what they believe to be facts in their daily operations. Questioning these "facts" may be taboo for the rest of the organization, but they are fair game to the data science team. After all, one of the data science team's key obligations is to challenge assumptions.
Whenever your data science team encounters a "fact," it should challenge the claim by asking the following questions:
When you're working on the data science team, you'll see all kinds of well-established "facts." The source of these "facts" are numerous and varied: intuition, personal experiences, examples, expert opinions, analogies, tradition, white-papers, and so on. Part of your job as a member of the data science team is to question these "facts," not reject them outright. As you explore, you may find evidence to support the "fact," evidence to refute it, a lack of evidence, or a mix of inconclusive evidence. Keep an open mind as you gather and examine the evidence.
It's easy to say that correlation doesn't imply causation — just because one event follows another doesn't mean that the first event caused the second — but distinguishing the difference between correlation and causation is not always easy. Sometimes, it is easy. If you bump your head, and it hurts, you know the pain was caused from bumping your head.
However, sometimes, it is not so easy. For example, when a doctor noticed that many children were developing autism after receiving a vaccination to protect against measles, mumps, and rubella, he and some of his colleagues found it very tempting to suggest a possible cause-effect relationship between the vaccination and autism. Later research disproved any connection. It just so happens that children tend to develop autism about the same time they are scheduled to receive this vaccination.
Whenever your data science team encounters an alleged cause-effect relationship, it should look for the following:
While true that "numbers don't lie," people frequently use numbers, specifically statistics, to lie or mislead. A classic example is in advertisement, where 80 percent of dentists recommend a specific toothpaste. The truth is that in many of these studies, dentists were allowed to choose several brands from a list of options, so other brands may have been just as popular, or even more popular, than the advertised brand.
When your team encounters statistics or a claim based on statistics, it needs to dig into those numbers and identify the source of the information and how the numbers were obtained. Don't accept statistics at face value.
Remember that a data science team can only be as good as the data (evidence) it has. Many teams get caught up in capturing more and more data at the expense of overlooking the data's quality. Teams need to continuously evaluate the evidence. The techniques described in this post are a great start.
Bottom line, the data science team needs to be skeptical. When presented with a claim or evidence to back up a claim, it needs to challenge it. An old Russian proverb advises "Trust but verify." I go a step further to recommend that you not trust at all — be suspicious of all claims and evidence that your data science team encounters.
In a previous post, "Data Analytics Questions," I recommend a couple ways to get the get the ball rolling when it comes to getting people in your organization to start asking compelling questions. However, getting people to ask better data questions is not always as simple as creating the right environment. Even a highly skilled data science team often needs more guidance.
To stimulate questions, it is often helpful to focus on specific areas that are fertile grounds for questions. In this post, I highlight three key areas that are not only the places you’ll find great questions, but also are a good place to start. These are questions that:
Note: These three areas are intended to initiate the process or get your team moving if it's stuck. Don't let these areas limit the scope of your exploration. If you address these three areas, you’re bound to come up with at least a few questions to grease the gears. When the team develops some momentum, team members will naturally ask more questions.
George Carlin once joked that he put a dollar in a change machine and nothing changed. Jokes like this are possible because many words in the English language have different meanings based on the context in which they're used and on different individual's understanding of the words. While jokes are funny, however, people often get into heated arguments when they don't have a shared understanding of what certain words or phrases mean. Just look at how different people define "success." For some, it's spending time with family, for others it's financial security, and for some knowledge or power.
The world of business is not immune to ambiguity inherent in certain terms; for example, ask two people to define "custom satisfaction." Does it simply mean that the person is a return customer? Is a customer who never complains satisfied? Can a customer who returns a product for a refund be satisfied? If a customer never buys another product, can we assume that customer was not satisfied?
Your data science team needs to be sensitive to ambiguous terms and nail down their intended meanings. Here's a short list of ambiguous terms commonly used in various organizations:
People often accept assumptions as facts. A company's leadership, for example, may believe that the company has such a unique manufacturing process that nobody can compete with it on price or quality even when that's not true. The truth may be that some other company has yet to develop something better or that there is an entirely new product being developed somewhere that will make the company's existing product obsolete — leadership just doesn't know about it yet.
In general, assumptions have four characteristics:
Data science teams must remain on the lookout for false or questionable assumptions. Not all assumptions are bad. If the assumption reflects reality and facilitates positive or productive decisions and activity, it can be helpful. However, false assumptions can create blind spots and introduce misinformation into the decision-making process.
Data science teams need to be aware of the possibility of errors in data and errors in reasoning, which are even worse. A data error may result in a minor setback or a series of false reports. On the other hand, an error in reasoning can lead the team down the wrong path or result in completely wrong conclusions. Watch out for the following types of logical fallacies(reasoning that results in invalid arguments):
All three of the techniques described in this post boil down to listening and observing closely and being skeptical about what you hear and observe. Whenever you encounter a statement presented as a fact, ask yourself, "Is this really true?" Whenever you encounter someone presenting a position, ask yourself, "Is the conclusion based on sound reasoning?" Questions like this force you to take a closer look and determine for yourself the truth and validity of a statement or conclusion.
The success of any data science initiative hinges on the team's ability to ask interesting data analytics questions that are relevant to the organization's success and its ability and willingness to challenge assumptions and beliefs. After all, without questions, you can have no answers. However, asking compelling questions and challenging long-held beliefs can be difficult, especially in organizations with strict hierarchies that discourage questioning and the challenging of authority.
If your data science team is struggling to come up with compelling questions and hesitates to challenge assumptions, the suggestions I present in this post can get the ball rolling. Getting started is the most difficult part. As soon as the team gets into the swing of asking questions and questioning beliefs, it will have no shortage of follow-up questions.
One of the best ways to encourage data science team members to ask questions and challenge beliefs is to build an environment that's conducive to the free exchange of ideas. The research lead is ultimately responsible and can start to nurture the free exchange of ideas by modeling the desired behavior — listening and learning without judging. Everyone on the team should engage in deep listening— focused listening that enables them to hear and understand what others are saying, ignoring any initial impulse to judge what they hear. Team members need to recognize that they have plenty of time later to analyze what they hear, but the first step is to fully understand what the other people are getting at.
A good way to encourage questions and reinforce deep listening is to conduct question meetings. In these meetings, the research lead should encourage participants to ask questions before making statements. This technique is sometimes called a "question first" approach. These meetings are about eliciting the maximum number of questions. They’re focused on everyone asking their questions and listening. Ban smartphones, laptops, and other electronic devices from these meetings. Everyone should focus on listening, with one person taking notes.
Although question meetings are mostly unstructured, consider starting the meeting like this:
Avoid quick statements that are likely to limit the scope of the discussion, such as "The CEO suspects that we are losing market share due to the recent reorganization of our marketing department." Such statements keep people from coming up with their best ideas. Remember that it’s the discussion that gives your team the greatest value. You want the team to consider all possibilities.
If you’re a fan of detective shows, you’ve probably seen a crime wall plastered with maps, photos, names, clues, sticky notes, and so on. The board functions as a combination collage, story board, and puzzle that provides the detective with a clear visualization of the evidence.
Your data science team can create its own "crime wall" by soliciting questions from across the organization through the use of a question board. Here are some suggestions for hosting an effective question board:
A question board delivers the following benefits:
Hosting question meetings and a question board are only two ways to encourage people in the organization to ask compelling questions. You are likely to come up with your own unique ideas. What's important is that you provide the encouragement and means for people to contribute their questions.
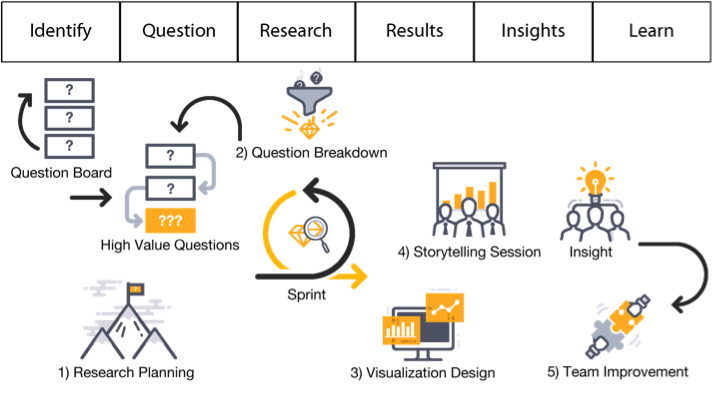
In my previous post, "The Data Science Life Cycle (DSLC)," I encourage you to adopt a structure for your data team's activities that is conducive to the type of work it does — exploration. I refer to this structure as the Data Science Life Cycle (DSLC), illustrated below.

At first glance, DSLC appears to be a linear process, starting with identification and ending with learning, but the process is actually cyclical. Learning leads to more questions that return the team to the beginning of the process. In addition, mini-cycles often form within the DSLC as research and analysis results prompt questions that require additional research and analysis to answer, as shown below.

In this post, I drill down to illustrate how data science teams can function more effectively and efficiently within the DSLC framework by employing the following techniques:
The DSLC isn’t designed to cycle over a long period of time. Two weeks is sufficient for a cycle (a sprint). That gives the team sufficient time to prepare and analyze the data and compose a story that reveals the knowledge and insight extracted from the data and its significance to the organization. With short cycles, if a specific line of enquiry proves fruitless, the team can change course and head in a different direction or tackle a new challenge.
You may have heard of sprints in the context of agile software development methodologies, such as Scrum, but the term actually originated in product development. A sprint is a consistent, fixed period of time during which the team runs through an entire lifecycle. Each sprint should run through all six stages of the DSLC, as shown below.

As I explained in an earlier post, "Data Science Team Roles," teams should be small (four to five individuals) and include a research lead, data analyst, and project manager. Although every member of the team should be asking compelling questions, the research lead is primarily responsible for that task.
One of the most effective ways to inspire and share interesting questions is via a question board— usually a large whiteboard positioned near the data science team on which team members and others in the organization post questions or challenges. The board should have plenty of open space with a short stack of sticky notes in one of the corners. You may want to include a large arrow pointing down to the stack of sticky notes with the caption, “Ask a question.”
The question board should be open to everyone in the organization, including the research lead, other data science team members, executives, managers, and employees. Try to make your question board look as enticing as possible. Anyone in the organization should be able to walk by, grab a sticky note, and post a quick question.
Given only two weeks to complete each sprint, your data science team should limit the amount of time it spends in meetings and keep those meetings focused on a specific purpose. I recommend that teams conduct five meetings over the course of a two-week sprint, each with a specific purpose and a time limit that the team agrees upon in advance:
Breaking down your work involves allocating a sufficient time to all six stages of the DSLC. What often happens is that data science teams get caught up in the research stage — specifically in the process of capturing, cleaning, and consolidating the data in preparation for analysis. Given only two weeks per sprint to deliver a story, the data science team has little time to prep the data. Like agile software development teams, the data science team should look to create a minimally viable product (MVP) during its sprint — in the respect to data science, this would be a minimally viable data set, just enough data to get the job done.
Remember, at the end of a sprint, stakeholders in the organization will want to know "What do we know now that we didn't know before?" If your team gets caught up in data prep, it won't be able to answer that question.
Organizations that make significant investments in any initiative want to see a return on investment (ROI), typically in the form of a deliverable. In the world of data science, the deliverable is typically in the form of an interesting story that reveals both the meaning and the significance of the team's discoveries. Unlike a presentation or data visualization, which merely conveys what the team sees, a story conveys what the team believes. A good story provides context for understanding the data, along with guidance on how that understanding can benefit the organization.
An effective story accomplishes the following goals:
A project lifecycle can be a useful tool for structuring the process that a team follows. (A lifecycle is a repeating series of steps taken to develop a product, solve a problem, or engage in continuous improvement.) It functions as a high-level map to keep teams moving in the right direction. Although data science teams are less goal-oriented than more traditional teams, they too can benefit from the direction provided by a project lifecycle. However, traditional project lifecycles are not conducive to the work of data science teams.
In this post, I discuss two more traditional project lifecycles and explain why they are a poor fit for data science "projects." I then present a data science life cycle that is more conducive to the exploratory nature of data science.
The software development lifecycle (SDLC) has six phases as shown below. Under each phase is an example of an activity that occurs during that phase. This is typically called the waterfall model because each one of these phases has to be complete before the next can begin.

SDLC works well for software development because these projects have a clearly defined scope (requirements), a relatively linear process, and a tangible deliverable — the software. However, this same lifecycle is poorly suited for data science, which has a very broad scope, a creative and often chaotic process, and a relatively intangible deliverable — knowledge and insight.
The Cross Industry Standard Process for Data Mining (CRISP-DM) lifecycle, which is used for data instead of software, is considerably more flexible than the waterfall model. It also has six phases, as shown below. The various phases aren't necessarily sequential, and the process continues after deployment, because learning sparks more questions that require further analysis.
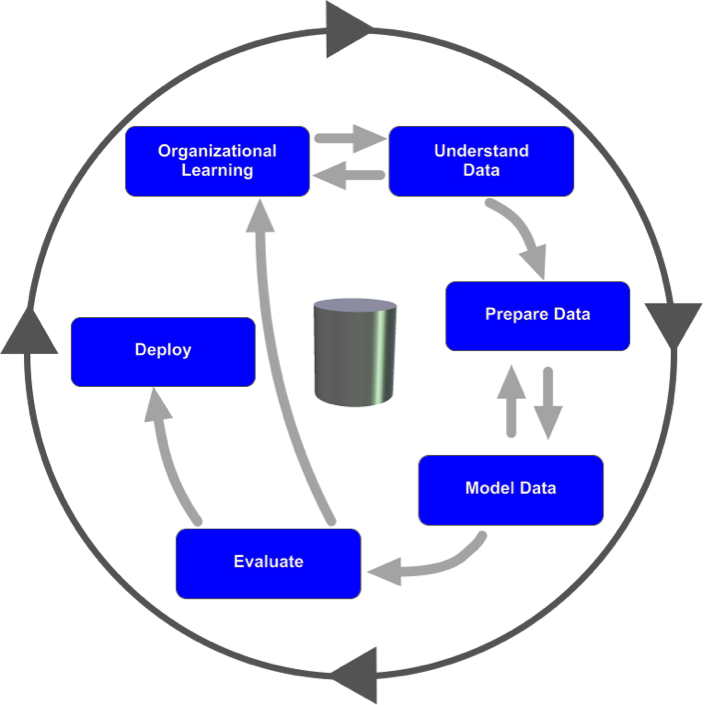
CRISP-DM works much better for data science than does SDLC, but, like SDLC, it is still designed for big-bang delivery — deployment. With either model, the data science team is expected to spend considerable time in the early stages — planning and analyzing (for software development) or organizational understanding (for data mining). The goal is to gather as much information as possible at the start. The team is then expected to deliver the goods at the end.
For a data science team to be flexible and exploratory, they can't be forced to adopt a standard lifecycle. A more lightweight approach is necessary to provide the structure necessary while allowing the team to be flexible and shift direction when appropriate.
The fact that traditional project lifecycles are not a good match for data science doesn't mean that data science teams should have complete operational freedom. These life cycles are valuable for structuring the team's activities. With a general sense of the path forward, the team at least has a starting point and some procedures to follow. A good lifecycle is like a handrail; it's there to provide support, but it's not something you need to cling to.
The approach that seems to work best for data science teams is the data science life cycle (DSLC), as shown below. This process framework, based loosely on the scientific method, is lightweight and less rigid than SDLC and CRISP-DM.
Like the two project life cycles presented earlier in this post, DSLC consists of six stages:
DSLC isn't always or even usually a linear, step-by-step process. The data science team should cycle through the questions, research, and results, as shown below, whenever necessary to gain clarity.
Some organizations that have strong data science teams already follow this approach. For example, the video subscription service Netflix used this approach to create their hit series “House of Cards.” They had 33 million subscribers at the time. Their data science team looked at what customers were watching, ratings of shows, what plots viewers liked, and the popular actors (Kevin Spacey was very popular at the time). Netflix determined that political shows were very popular and hired Spacey. Then they modeled the new show on the popular British version of the program.
The Netflix team used data science to develop the idea for the show. They created a predictive model based on analysis of viewer demand. They worked to cycle through questions, research, and results. They then created a story of what their customers would like to see. That story became an actual story that turned into a hit television program.
This cycle of question, research, and results drives insights and knowledge. The data science team loops through these areas as part of the larger DSLC. Remember to not think of this lifecycle as a waterfall process. Instead, think of it as a few steps to start and then a cycle in the middle to churn out great stories at the end.
In a previous post, "Data Science Projects," I point out some of the key differences that separate data science from traditional project management. While traditional project management is focused more on goals, planning, and tangible deliverables, data science is a more open-ended operation with the focus on discovery and innovation — less tangible, but no less valuable, deliverables.
To arrive at a deeper understanding of the differences between traditional project management and data science, consider the unique challenges of a data science project:
Let’s look at a traditional project and compare it to what a data science team does. Then, we'll look at what often happens when traditional project management is applied to a data science team.
Consider a typical software project. Your organization wants to develop a human resources (HR) self-help portal for its employees. The project charter is to create the portal as a way to lower costs and improve overall employee satisfaction. The project will have a set cost, but the organization will save money by reducing HR costs and employee turnover. The estimated return on investment (ROI) for this project is substantial. The plan lays out all the features in a requirements document and includes a development schedule and detailed budget. The project manager will oversee development and update the plan to account for any changes in schedule, budget, or product requirements.
In contrast, consider how a data science team operates. The team is small — four to five people, including a research lead, a couple data analysts, and a project manager. Their "mission" is to help the organization come to a better understanding of the customers’ needs and behaviors in the hopes that this deeper understanding reveals opportunities to generate more revenue.
The research lead starts by asking questions such as these:
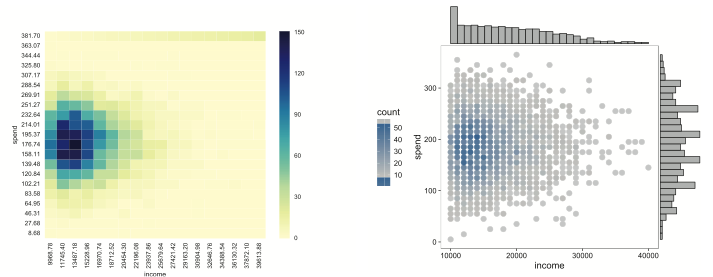
The data analysts do their job — analyze the data — to come up with answers to these questions. They deliver the answers in the form of data visualizations — graphic summaries of the data. For example, the data visualizations may be graphs that shed light on customer income and spend, as shown here. The x-axis (horizontal) represents income, and the y-axis (vertical) represents spending. Note that customers with higher incomes don’t necessarily spend more. Those who have an income around $20k–$30k seem to spend the most.
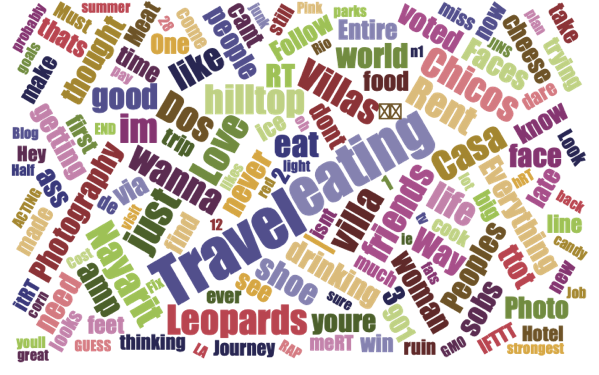
The analysts could also look at data from social media platforms and create a word cloud of feedback from thousands of customers, as shown below. For example, some of the largest words in the word cloud are “travel,” “recipe,” and “restaurant.”
Based on the knowledge and insight gleaned from these data visualizations, the team is likely to ask more questions, such as "Why do customers in a certain income bracket spend more than customers in higher or lower income brackets?" and "Why do our customers like to travel?" and "When our customers travel, where are they most likely to go?"
As you can imagine, knowing more about customers can lead to higher sales. The team could then share its discoveries with others in the organization. Marketing may decide to advertise more in travel magazines. Product development may shift its focus to products that are more closely related to travel. Sales might focus more if its efforts toward customers in a specific income bracket.
Then again, the team may hit a dead end. A data visualization created to analyze spending patterns among customers who travel and those who don't is inconclusive, as shown below. It reveals only that customers who travel outspend, by a relatively small margin, those who don't travel and that customers who do travel visit a variety of destinations around the world and the total spend by customers who travel to those destinations is no greater than the total spend by customers who don't travel. The data visualization doesn't provide sufficient evidence to support a change in what the company is doing, so the team abandons this line of enquiry and shifts direction.

Imagine trying to shoe-horn data science into a traditional project management framework. How would you define the scope of the project when your exploration can lead you in so many different directions? How can you meet predetermined milestones when you're building an ever-increasing body of knowledge and insight about your customers? How can you possibly meet a deadline when you don't know, specifically, what you're looking for? How do you budget for time when you have no idea how long it will take to find the answers?
Data science is all about learning, and "learning" is a verb. Specifically, it is a verb in the form of a present participle, which conveys continuous action. Data science is engaged in ongoing discovery and innovation. It doesn't conform to the traditional project management framework. Don't try to force it to.
In my previous post, "Data Science Projects," I pointed out the differences between project management and data science. These differences are summarized in the following table:
| Project Management | Data Science |
| Planning | Exploring and experimenting |
| Goals and objectives | Discovery and knowledge |
| Schedule- and budget-driven | Data-driven |
| Certainty | Curiosity |
| Execution | Innovation |
You can see how these differences play out when comparing traditional software projects to typical data science projects, as presented in the following table. While traditional software projects are focused more on achieving a goal and delivering an end product, data science projects are more exploratory and open ended. Both have deliverables, but with software projects, the deliverables are more tangible and deadline-oriented, whereas data science tends to deliver a less tangible and ever growing body of knowledge and insights, which may be of even greater value to the organization.
| Traditional Software Project | Typical Data Science Project |
| Develop a new customer self-help portal | Better understand a customer’s needs |
| Create new software based on customer feedback | Create a data model to predict churn |
| Install a new server farm to increase scalability | Discover new markets and opportunities |
| Convert legacy code into updated software | Verify assumptions about customer behaviors |
Despite their differences, software project management is fast becoming more like data science with the growing popularity of agile software development methodologies, such as Scrum, Extreme Programming (XP), Lean and Kanban, and Dynamic Systems Development Method (DSDM).
Like data science, many of these newer software development methodologies follow the scientific method, at least to some degree. That is, they often begin with research to assess the customer's (end user's) needs, and they build the software gradually in multiple, iterative cycles (commonly referred to as "sprints"). Team members are encouraged to experiment during these cycles to innovate and build knowledge that the team can draw on to achieve continuous improvement, both in the product being developed and the process used to create that product.
In many cases, the software development cycle is never-ending — the software is in continuous development, improving continuously with each development cycle and with each new release. As with data science, the focus is more on the process than the product and is open-ended — a never-ending cycle of building knowledge and insight and driving innovation. In the case of software development, this knowledge and insight is applied to continuously improve the software. With data science, the knowledge and insight is applied to continuously improve the organization.
Spotify, the digital music, podcast, and video streaming service, follows this same iterative approach in the development of its platform. The company nurtures a creative, failure-friendly culture, as reflected in its values:
Spotify's approach to software development is rooted in the Lean Startup approach of "Think it, build it, ship it, tweak it." The organization even hosts "hack days" and "hack weeks," encouraging its development teams (called "squads") to spend ten percent of their time building whatever they want with whomever they want.
Squads are given a great deal of creative license to develop and test new features with the condition that they try to "limit the blast radius." They accomplish this by decoupling the architecture to enable each squad or "tribe" (a collection of squads) to work on an isolated part of the platform, so any mistakes are limited to that part; and by rolling out new features gradually to more and more users.
Spotify also places an emphasis on "capturing the learning." Teams experiment with new tools, features, and methods and then discuss the results to figure out ways to improve both product and process. They document what they learn and share it with other teams, so everyone in the organization is better equipped to make data-driven decisions instead of decisions driven by authority, ego, or opinion.
Organizations would be wise to follow Spotify's lead not only in developing new software but also in managing their data science teams — or, even better, in allowing and enabling the data science teams to manage themselves. Your organization's data science team should feel free to ask questions, challenge assumptions, formulate and test their own hypothesis, and cross pollinate (reach out to others in the organization for insight and feedback). The team's mission should be more about exploration, innovation, and discovery than about setting goals, meeting milestones, and staying on budget or on schedule.
The heartbeat of most organizations can be measured in projects. Various teams across the organization set goals and objectives, develop plans for meeting those goals and objectives, and then implement those plans in the hopes of executing their missions on schedule and on budget. Project management has been the shiny hammer that has helped to nail down costs and meet deadlines throughout the process. It has been so successful that organizations often rely on project management even when it’s poorly suited for a given activity, as is the case with creative endeavors.
Data science is one area in which project management is a poor match. Data science projects often operate without clearly defined goals or objectives. Their primary purpose is to explore — to mine data for organizational knowledge and insights. Of course, sometimes, they have a clear objective — a specific question to answer or problem to solve or a data-driven software solution to develop, such as developing a machine learning algorithm to automate a specific task. To accomplish clearly defined tasks, project management may help even in the realm of data science, but for the most part, data science functions better with less goal-oriented management.
By its very nature, data science is empirical; that is, it relies more on observation and experience than on theory and logic. Data science projects are primarily exploratory and data-driven, not schedule- or budget-driven. One day, a data science team may be mining the data to identify new opportunities. Another day, it may be looking for ways to better understand the organization’s customers or to more accurately detect signs of data breaches or fraud. These efforts don’t fit into a typical project management framework. Data science teams are often operate outside the scope of other functions in the organization and often explore data that’s outside the scope of what the organization captures on its own.
When you set out on an exploratory mission, you don’t know specifically what you’re going to find. The entire purpose of the mission is to uncover what is currently unknown — to unlock the secrets hidden inside the data. Data science teams celebrate those eureka! moments, when they stumble upon unexpected discoveries. To maximize their discoveries, data science teams must be able to react to the data. They must be allowed to follow where the data leads and change course when questions point them in a new direction. If they knew exactly what to expect, they wouldn’t be gaining any new knowledge.
In general, data science looks for new opportunities or challenges current assumptions. It focuses on knowledge exploration and tries to deliver insights. It’s not about cranking out deliverables on a predetermined schedule.
The difference between data science and project management is like the difference between exploring and planning. Imagine yourself exploring an unfamiliar area to find a restaurant. This would be an empirical process, similar to the approach a data science team would take. You would tour the area checking out different restaurants and their menus. You might even step inside the restaurants to check out their ambience and cleanliness and the friendliness of the staff and compare prices.
While you are exploring restaurants, you work up an appetite. You’re famished. Now, you need to decide what you’re hungry for, where and when you want to eat, how much you want to spend, and so on. You may even want to contact someone you know to meet you at the restaurant. In this scenario, you have a specific goal in mind — enjoying your next meal. To achieve that goal, some degree of planning is required. You switch from learning to planning, from data science to project management.
I once worked for an organization that tried to apply sound project management practices throughout the organization. The data science team was no exception. The team tried to adhere to the new policies by creating knowledge milestones and insight deliverables. Unfortunately, this particular experiment was a disaster. The knowledge milestones were imaginary constructs based on what the team already knew. They kept the team from exploring anything outside the scope of those milestones. Time constraints drove the team to focus on hypotheses that were easily proved or bordering on the obvious. Whenever someone ventured to ask an interesting question or attempted to challenge an assumption, that person was shut down because the team was afraid of missing a milestone.
Keep in mind that project management is beneficial to most organizations. Unfortunately, the same approach can have a chilling effect on a data science team. Project management discourages curiosity and uncertainty. It forces the data science team to merely try to verify what is already known. If they find anything unexpected, they dismiss it as a minor anomaly or a glitch instead of as a sign that they need to change direction or dig deeper for the truth.
By setting milestones and defining specific deliverables, you gamify the data science process in a counterproductive way. You end up rewarding the data science team for the wrong achievements. Instead of rewarding curiosity, questioning, and experimentation, you’re rewarding the team for verifying what’s already known.
Bottom line: Don’t think of data science as a project delivering a product. Think of it as exploration for driving discovery and innovation.