9450 SW Gemini Drive #32865
Beaverton, Oregon, 97008-7105
As I explained in a previous article, “Building a Data Science Team,” a data science team should consist of three to five members, including the following:
Together, the members of the data science team engage in a cyclical step-by-step process that generally goes like this:
Data science teams also commonly run experiments on data to enhance their learning. This will help the team collaborate on many data-driven projects.
Experiments generally comply with the scientific method:
Suppose your data science team works for an online magazine. At the end of each story posted on the site is a link that allows readers to share the article. The data analyst on the team ranks the stories from most shared to least shared and presents the following report to the team for discussion.
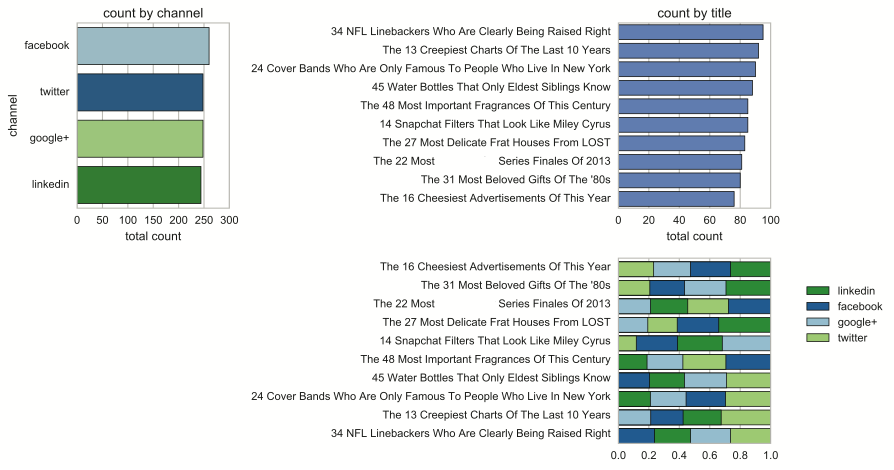
The research lead asks, “What makes the top-ranked articles so popular? Are articles on certain topics more likely to be shared? Do certain key phrases trigger sharing? Are longer or shorter articles more likely to be shared?”
Your team works together to create a model that reveals correlations between the number of shares and a number of variables, including the following:
The research lead is critical here because she knows most about the business. She may know that certain writers are more popular than others or that the magazine receives more positive feedback when it publishes on certain topics. She may also be best at coming up with key words and phrases to include in the correlation analysis; for example, certain key words and phrases, such as “sneak peek,” “insider,” or “whisper” may suggest an article about rumors in the industry that readers tend to find compelling. This will create a visualization that can communicate even big data to people without a data skill set.
Based on the results, the analyst develops a predictive analytics model to be used to forecast the number of shares for any new articles. He tests the model on a subset of previous articles, tweaks it, tests it again, and continues this process until the model produces accurate “forecasts” on past articles.
At this point, the project manager steps in to communicate the team’s findings and make the model available to the organization’s editors, so it can be used to evaluate future article submissions. She may even recommend the model to the marketing department to use as a tool for determining how to charge for advertising placements — perhaps the magazine can charge more for ads that are positioned alongside articles that are more likely to be shared by readers.
Although you generally want to keep your data science team small, you also want people on the team who approach projects with different perspectives and have diverse opinions. Depending on the project, consider adding people to the team temporarily from different parts of the organization. If you run your team solely with data scientists, you’re likely to lack a significant diversity of opinion. Team member backgrounds and training will be too similar. They’ll be more likely to quickly come to consensus and sing in a chorus of monotones.
I once worked with a graduate school that was trying to increase its graduation rate by looking at past data. The best idea came from a project manager who was an avid scuba diver. He looked at the demographic data and suggested that a buddy system (a common safety precaution in the world of scuba diving) might have a positive impact. No one could have planned his insight. It came from his life experience.
This form of creative discovery is much more common than most organizations realize. In fact, a report from the patent office suggests that almost half of all discoveries are the result of simple serendipity. The team was looking to solve one problem and then someone’s insight or experience led in an entirely new direction.
In my previous post, "Data Science Evidence," I encourage data science teams to be skeptical of any claims or evidence that supports those claims, and I provide several techniques for challenging claims and evidence.
However, missing data can be just as misleading as wrong data, if not more so. One of the big problems with missing data is that people can't see what's not there. When you have data, you can check for errors and validate it. With missing data, you have nothing to check. You may not even think to ask about it or look for it.
For example, suppose you see the following graph with the headline: “Major Heat Wave in Atlanta!"
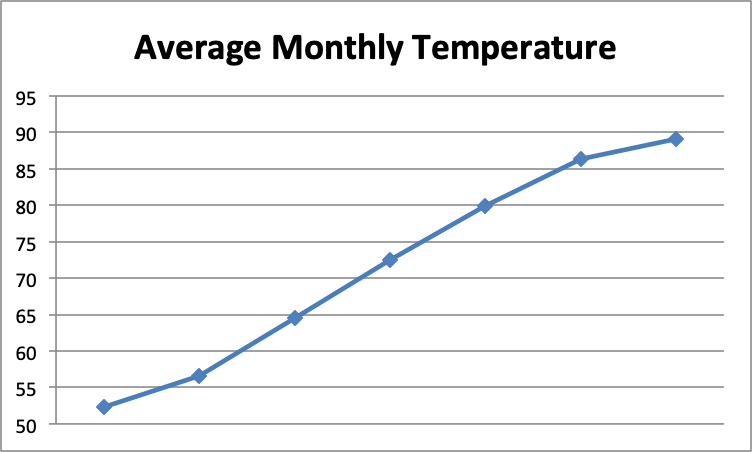
Your initial reaction might be that temperatures are rising precipitously in Atlanta and something must be done to reverse this dangerous trend. What's missing from this graph? The months along the horizontal axis: January through July. Of course monthly temperatures are going to rise dramatically over the spring and summer months!
I once worked for an organization that was trying to figure out why more men than women were participating in their medication trials. A report from the company's labs showed that 60 percent of its study participants were men compared to only 40 percent who were women. The data science team was assigned the job of finding out why men are more likely to participate in the company's medication studies than women.
When team members received this report, they asked, “What significant information are we missing?” “What does it mean that men are more likely than women to participate?” Does that mean that more men applied or that equal numbers of men and women applied but that a greater number of men were accepted? Or does it mean that equal numbers of men and women applied and were accepted but more men actually participated?
This additional data would shift the team's exploration in different directions. If more men applied, the next question would be "Why are men more likely than women to apply for our medication studies?" If equal numbers of men and women applied but more men were accepted, the next question would be "Why are more men being accepted?" or "Why are more women being rejected?" If equal numbers of men and women applied and were accepted but more men actually participated, the next question would be "Why are men more likely to follow through?" As you can see, the missing data has a significant impact on where the team directs its future exploration.
When you encounter a scenario like this, consider both what data might be missing and why it might be missing:
This last question turned out to be significant. The benefit to having more women participate in the company's studies is that young women are more likely to be on prescription medication, which would make the studies more comprehensive. The medication studies would be able to test for a greater number of drug interactions. The flip side is that many women couldn't participate because they were taking a prescription medication that prohibited them from participating in the study. The statistic could then be rephrased as "60 percent of those who are allowed to participate in our medication studies are men.” This tells an entirely different story.
Data science teams need to remain vigilant regarding missing information. If a claim seems too good or too bad to be true, the team needs to question it and ask, "What's the rest of the story? What's missing? What's been omitted, intentionally or not?" The team also should always be asking, "Do we have all the relevant data?"
Data drives the data science team's exploration and discovery, so the team must be on the constant lookout for bad data, which can lead the team astray or result in erroneous conclusions. In this post, I present several ways to challenge the data science evidence the team is provided to ensure that the team is working with accurate information and to generate addition questions that may lead to valuable discoveries.
Many organizations rely on what they believe to be facts in their daily operations. Questioning these "facts" may be taboo for the rest of the organization, but they are fair game to the data science team. After all, one of the data science team's key obligations is to challenge assumptions.
Whenever your data science team encounters a "fact," it should challenge the claim by asking the following questions:
When you're working on the data science team, you'll see all kinds of well-established "facts." The source of these "facts" are numerous and varied: intuition, personal experiences, examples, expert opinions, analogies, tradition, white-papers, and so on. Part of your job as a member of the data science team is to question these "facts," not reject them outright. As you explore, you may find evidence to support the "fact," evidence to refute it, a lack of evidence, or a mix of inconclusive evidence. Keep an open mind as you gather and examine the evidence.
It's easy to say that correlation doesn't imply causation — just because one event follows another doesn't mean that the first event caused the second — but distinguishing the difference between correlation and causation is not always easy. Sometimes, it is easy. If you bump your head, and it hurts, you know the pain was caused from bumping your head.
However, sometimes, it is not so easy. For example, when a doctor noticed that many children were developing autism after receiving a vaccination to protect against measles, mumps, and rubella, he and some of his colleagues found it very tempting to suggest a possible cause-effect relationship between the vaccination and autism. Later research disproved any connection. It just so happens that children tend to develop autism about the same time they are scheduled to receive this vaccination.
Whenever your data science team encounters an alleged cause-effect relationship, it should look for the following:
While true that "numbers don't lie," people frequently use numbers, specifically statistics, to lie or mislead. A classic example is in advertisement, where 80 percent of dentists recommend a specific toothpaste. The truth is that in many of these studies, dentists were allowed to choose several brands from a list of options, so other brands may have been just as popular, or even more popular, than the advertised brand.
When your team encounters statistics or a claim based on statistics, it needs to dig into those numbers and identify the source of the information and how the numbers were obtained. Don't accept statistics at face value.
Remember that a data science team can only be as good as the data (evidence) it has. Many teams get caught up in capturing more and more data at the expense of overlooking the data's quality. Teams need to continuously evaluate the evidence. The techniques described in this post are a great start.
Bottom line, the data science team needs to be skeptical. When presented with a claim or evidence to back up a claim, it needs to challenge it. An old Russian proverb advises "Trust but verify." I go a step further to recommend that you not trust at all — be suspicious of all claims and evidence that your data science team encounters.
Building a data science team is not as simple as hiring a database administrator and a few data analysts. You want to democratize your data — you want the organization’s data and the tools for analyzing it in the hands of everyone in the organization. You want your entire organization to think about your data in creative and interesting ways and put the newly acquired information and insights into action.
Yet, your organization should have a small data science team that’s focused exclusively on extracting knowledge and insights from the organization’s data. Approach data science as a team endeavor — small groups of people with different backgrounds experimenting with the organization’s data to extract knowledge and insights.
Keep the team small (three to five members, max). You need to fill the following three positions:
In the following sections, I describe these roles in greater detail.
Note: When building a data science team, you’re essentially breaking down the role of data scientist into three separate positions. Finding a single individual who knows the business, understands the data, is familiar with analytical tools and techniques, and is an effective project manager is often an insurmountable challenge. Creating a team enables you to distribute the workload while ensuring that the data is examined from different perspectives.
The research lead has three areas of responsibility:
The research lead should be someone from the business side — someone who knows the industry in which the business operates, the business itself, and the unique intelligence needs of the business. He or she must recognize the role that the data science team plays in supporting the organization’s strategic initiatives and enabling data-driven decision-making at all levels.
A good research lead is curious, skeptical, and innovative. Specialized training is not required. In fact, a child could fill this role. For example, Edward Land invented the Polaroid instant camera to answer an interesting question asked by his three-year-old daughter. When they were on vacation in New Mexico, after he took a picture with a conventional camera, his daughter asked, “Why do we have to wait for the picture?”
Asking compelling, sometimes obvious, questions sounds easy, but it’s not. Such questions only seem easy and obvious after someone else asks them.
Of course, asking compelling questions is something everyone in your organization should be doing. Certainly everyone on the data science team should be involved in the process. However, having one person in charge of questions provides the team with some direction.
Maintaining separation between the people asking the questions and the people looking for possible answers is also beneficial. Otherwise, you’re likely to encounter a conflict of interest; for example, if the people in charge of answering questions are working with a small data set, they may be inclined to limit the scope of their questions to the available data. A research lead, on the other hand, is more likely to think outside that box and ask questions that can’t be answered with the current data. Such questions would challenge the team to capture other data or procure data from a third-party provider.
Your data science team should have one to three data analysts to work with the research lead to answer questions, discover solutions to problems, and use data in creative ways to support the organization’s operations and strategy. Responsibilities of a data analyst include the following:
Note: The data analyst on the team should be familiar with software development. Many of the best data visualization tools require some software coding.
The primary purpose of a project manager is to protect the data science team from increasing demands placed on it from the rest of the organization. For example, I once worked for an organization that had a very creative data science team. They were coming up with new and interesting ways to use the company’s vast credit card data. During the first few months, the data science team was mostly left alone to explore the data. As their insights became more interesting, the rest of the organization became more curious. Departments started calling on team members to give presentations. These meetings increased interest across the organization, which led to even more meetings. After a few months, some people on the data science team were in meetings for up to twenty hours a week! They shifted roles from analysts to presenters.
As a result, the team spent much less time analyzing data. The same departments who were requesting the meetings started asking why output from the data science team was dwindling.
An effective product manager serves as a shield to protect the team from too many meetings and as a bulldozer to break down barriers to the data. In this role, the project manager has the following responsibilities:
Working together, the research lead, analysts, and project manager function as a well-oiled machine — asking and answering questions, uncovering solutions to problems, developing creative ways to use the organization’s data to further its competitive strategy, and working with other groups and individuals throughout the organization to implement data-driven changes.
Many people have the misconception that science is equivalent to truth. In fact, people often cite science as the authority on a specific issue. They seem to believe that anyone who challenges scientific claims is challenging the truth and in so doing is completely un-scientific. The fact is that a large part of what goes on in the world of science is a continuous process of asking and answering questions and challenging theories and conclusions drawn from previous studies. Science, including data science, is about asking and seeking answers to relevant questions. Science is not truth; it is the search for truth.
However, all scientists are human. As such, they are susceptible to bias, logical fallacies, and other errors that can corrupt data and the conclusions drawn from that data. In this post, I describe the most common data science pitfalls in the hopes that by knowing about them, you’ll be better equipped to avoid them.
A major pitfall in data science is what I call the “cluster of dreams.” It’s based on the movie Field of Dreams starring Kevin Costner. The movie is about a man who spends his life savings building a baseball diamond in a cornfield. The ghosts of old players visit the area where the diamond is to be built and urge him on by saying, “If you build it, they will come.”
With data science, organizations often believe that if they put the right technologies in place and gather enough data, all their questions will be answered and all their problems solved. They focus their energy on building a data warehouse and collecting massive amounts of data. They make large investments in software to run on large data clusters. With everything in place, they begin to capture large volumes of data. Then, progress grinds to a halt. They have no idea what to do with that data.
To avoid this trap, take the following precautions:
Many organizations underestimate the shift in mindset required for a successful data science initiative. It’s not as simple as having a group of statisticians looking at the data. It’s about treating your organization’s data in a different way — not as a static resource that needs to be controlled, but as a dynamic resource that needs to be explored.
Changing the organization’s mindset involves letting go of strategies that may have worked well in the past. If you want to explore, you can’t have project objectives and planned outcomes. These are often barriers to discovery. You have to be comfortable with the idea that you don’t know where the data may lead.
To avoid this trap of setting objectives and planning outcomes, take the following precautions:
Data science teams should be focused less on objectives and more on exploration, but they still must produce something of value — organizational knowledge and insight. Teams that explore without a framework in place tend to wander. They get lost in the data and often make a lot of insignificant and irrelevant discoveries.
To avoid this trap, approach data science as you would approach agile software development. Work in “sprints” with regularly scheduled team meetings to ask questions, troubleshoot problems, and share stories. Storytelling is a great way to encourage the team to extract meaning and insights from the data. If the team is unable to tell a compelling story with the data and discoveries it has made, it probably isn’t aligning its efforts with the organization’s business intelligence needs.
In 1999, two psychologists conducted an experiment. They filmed six people passing a ball and showed it to 40 students. Prior to playing the video, they instructed the students to count the number of times the ball was passed. Most of the students came up with an accurate count. However, none of them mentioned the person in the gorilla suit who walked into the center of the circle, stopped, and then walked off camera. When asked about the gorilla, half the students hadn’t noticed it. In fact, they were so convinced it wasn’t there that they had to watch the video again to be convinced. The psychologists labeled this affliction perceptual blindness.
The same phenomenon occurs in organizations, and even with data science teams. People get so caught up in their routine work that they fail to notice what is most significant. On a data science team, members often get so involved in the process of capturing, cleaning, and storing the data that they overlook the purpose of that data.
For example, in a storytelling session, a data analyst clicked down deep into a data visualization to show the detail. The example was from an ad for a red Ford Mustang. For some reason this ad did very well. It had a much higher click-through rate. One of the stakeholders on the team interrupted the presentation and asked why the ad was so successful. The data science team hadn’t even considered that question.
When your data science team makes a discovery, it’s not “mission complete.” You have to connect the discovery to real business value, which isn’t always easy, because you rarely start out knowing what you’re looking for. At first, you may not even realize that what you discovered has any business value.
One of the benefits of working in sprints is that you discover and deliver insights a little at a time — every two weeks. With each sprint, you build on what you know. The research lead on the team has the opportunity to evaluate the insights every two weeks and connect them to business value. And if the team is on the wrong path, the research lead can point that out, and the team can discuss ways to change direction.
Forcing your data team to connect insights to business value is a pretty good way to avoid most, if not all, of the most common data pitfalls. As long as the team is focused on extracting valuable business intelligence from the organization’s data, it will remain on the right path.
Data science teams capture, store, and analyze data to extract valuable information and insight. In recent posts, I focused on capturing and storing three types of data — structured, semi-structured, and unstructured — and I encouraged readers to avoid the common trap of allowing big data to become big garbage.
In this article, I shift focus to analysis — using statistics, mathematics, and other analytical tools to extract meaning and insight from data. Although specific statistical methods vary considerably, they can be broken down into the following five categories:
In the following sections, I describe each of these five approaches to statistical analysis in greater detail and provide a word of caution at the end.
Descriptive statistic is a quantitative summary of a collection of data. Descriptive statistics include the following:
Descriptive analytics are great for story-telling, proving a point, and hiding facts, which is why this approach is commonly used in political campaigns. One candidate may claim, “Over the last four years, average salaries have risen $5,000,” while her opponent claims, “Compared to four years ago, a typical middle class family now earns $10,000 less.” Who’s telling the truth? Maybe they both are. Opposing candidates often draw on the same data and use descriptive analytics to present it ways that support whatever point they’re trying to make.
In this example, the first candidate uses the mean to show that the average family earned about $5,000 more. The opposing candidate used the median(typical middle class family, not including poor or rich families) to make the case that a certain segment of the population was now earning less than they did four years ago. Both candidates are right, while neither candidate presents the entire truth.
Probability is the likelihood that something will happen. If you flip a coin, the probability is 50 percent it will land heads or tails. If you roll a six-sided die, you have a 1/6 or about a 17 percent probability of rolling any given number from one to six. Probability can also be used to gauge the likelihood of a coin landing heads twice in a row or rolling a specific number on a die twice in a row.
In data science, calculating probabilities can produce valuable insights. I once worked with a biotech company that was trying to determine the probability of people participating in a clinical trial, which is impacted by a number of factors. If participants are required to fast the night before, they’re about 30 percent less likely to participate. If a needle or a blood test is required, they’re about 20 percent less likely to participate. These results enabled the company to consider alternatives, such as replacing the blood test with a saliva test. However, they then had to analyze the possible impact on the results of the study if they made that change.
Data science is like that. The answer to one question may lead to other questions requiring additional analyses. When working on a data science team, be prepared to ask follow-up questions and harness the power of data to answer them.
Correlation is another very interesting area in data science. Many companies use correlation to analyze customer data and make targeted product recommendations. For example, Netflix looks at all the movies and TV shows you watched to recommend movies that are likely to appeal to you. Likewise, Amazon analyzes your purchase and search histories to recommend products you might like.
Correlations are commonly broken down into two categories:
Data science teams look for correlations, as measured by the correlation coefficient— a value between –1 and 1 that indicates how closely related two variables are. Zero (0) indicates no correlation, 1 indicates a strong positive correlation, and –1 indicates a strong negative correlation.
Correlation is also useful for testing assumptions. For example, if a business assumes that customers who buy the most are the most satisfied, it could run correlation analysis to compare spending and satisfaction in order to prove or disprove that assumption.
Causation is correlation with a twist. The twist is that the two variables being studied are related through cause and effect. Keep in mind, however, that correlation does not prove causation. Just because it rains every time I forget to close my car windows doesn’t mean that forgetting to close the windows causes it to rain.
For example, when my parents got older, they moved to a retirement community in southern Florida. Statistically, their community is one of the most dangerous places on earth. People are constantly being hospitalized or buried. If you looked at the correlation between the community and rates of hospitalizations and deaths, you’d think they lived in a war zone. But the actual correlation is between age and rates of hospitalizations and deaths. The community is very safe.
If causation is proven, it can come in very handy for answering “Why” questions. Why do sales drop off in July? Why do people who live in a certain location have a greater incidence of lung cancer? Why are so many people returning our product? Careful analysis of the right data can answer these and other probing questions.
Perhaps the most fascinating and valuable application of statistical analysis is predictive analytics. Imagine having a crystal ball that enables you to see the future. By peering into that crystal ball, an organization could see the next big thing. It could tell what the competition was going to do before the competition knew. It could spot developing trends and be first to market with hot-selling products.
Think of predictive analytics as weather forecasting. Nobody really knows what the weather will be like the next day, but meteorologists can look at current data and compare it to historical data to make an accurate prediction of what the weather will be several days from today. They combine various types of data, including temperatures, pressures, humidity levels, and wind directions and speeds; analyze the data to spot patterns; correlate the patterns with historical data; and then draw their conclusions.
In the same way, organizations in a variety of sectors can analyze the data they have to spot patterns and trends and make predictions. And with the growing volume of data in the world, these predictions are becoming more and more precise.
Regardless of the approaches you use to analyze your data, be curious and skeptical. Data and the conclusions drawn from that data can be misleading, so challenge assumptions and conclusions. Ask questions, such as “Does this answer or conclusion make sense?” “Did we use the right data?” “What am I missing?” and “What else could this mean?” Use different analytical methods to examine the data from different perspectives. As a data scientist, you need to think like a scientist.