9450 SW Gemini Drive #32865
Beaverton, Oregon, 97008-7105
When organizations capture and analyze big data to extract knowledge and insight from it, they often must aggregate three types of data:
In this article, I highlight the differences among these three data types.
Comprising about 10 percent of all available data, structured data is typically stored in a relational database consisting of interrelated tables. Every record has a unique identifier (a primary key), and every data entry is “labeled” with a field name to simplify the process of using and managing the data. Structured data is like the bricks and mortar of the database world. It’s cheap, inflexible, and requires a lot of upfront development.
A good example of structured data is a typical office spreadsheet. When you fill rows with data, you have to stick to a pretty rigid format and structure. For example, suppose you have a column called “Purchase Date.” Each entry in that column must be in a specific format. You can’t have “Tuesday” as one entry and “March” as another. For a purchase date, you want to specify the day, month, and year, and you want all the entries to be consistent. One way to ensure consistency is to create a rule that every entry in the Purchase Date column must be in the MM/DD/YYYY format.
Without a consistent format, you would have a difficult time extracting specific data and using it to create a report, for example. Imagine trying to create a sales report for a certain date range if some dates were spelled out (such as February 2, 2019) while others were numerical (such as 03/29/2020) and some were abbreviated (such as Jan 23, 2020). Any query used to extract date information would need to cover all the variations in the date format.
Most data that an organization generates and uses internally is transaction data, which can be highly structured. Sources of structured data include the following:
With structured data, you have all your data neatly arranged in a relational database, where everything is labeled and organized. You know where everything is, and you know exactly where to find it. It’s like storing spices in labeled jars arranged alphabetically in a spice rack. You know where everything is and you know exactly where to find it.
Semi-structured data contains tags or other markers to “label” data entries without forcing the data into a strict structure such as a table. Semi-structured data is typically stored in a text file that includes metadata— the tags or markers that identify or provide additional information about the data entries. Files that include semi-structured data are commonly saved in one of the following formats, which are generally easy for humans to read and understand:
Sources of semi-structured data include the following:
The most common type of data is everything that isn’t structured or semi-structured: it is unstructured data. Some analysts estimate that 80 percent of all data is unstructured. When you think about it, this makes a lot of sense. Think about the data you encounter every day:
What does all this data have in common? Not much, and that’s part of the problem. None of this data is structured in any uniform way. The data contained in these files are not arranged in tables or entered into specific fields. The content may or may not be tagged to describe what it contains. Even the file formats differ. If you had a dozen documents you couldn’t open, you’d struggle to figure out what was in each one. The challenge would be even greater if you needed to extract details from the documents and aggregate relevant data.
Fortunately, companies such as Google have been working for years to overcome these limitations. Every time you search Google, Bing, or Yahoo!, you reap the fruits of their labor. Whenever search for something on these sites, you’re presented with a long list of links to a variety of content, including web pages, Word documents, PDFs, images, audio, and video. Organizations in diverse industries use many of the same and similar technologies to capture, store, retrieve, aggregate, and analyze unstructured data.
Suppose you own a business that sells running shoes online and you want to identify your best customers. First, you may want to define what you mean by “best customer.” Is your best customer the one who spends the most money in your webstore? Is it the person who suggests ideas for improving your products? Is it the customer who recommends your product the most on social media? Maybe your best customer meets all these criteria.
If your definition of best customer is the person who spends the most in your webstore, all you need is a simple query to your transactional database to rank customers in order from those who spent the most to those who spent the least. For a more sophisticated 360-degree perspective, you could aggregate data from your transactional database, from social media sites such as Facebook and Twitter, and from other sources. Using customer names and email addresses you already have, you can crawl social sites to find out what customers posted about your product — maybe a comment on Facebook or Twitter or a video on YouTube. You can then analyze the aggregated data (structured, semi-structured, and unstructured) to identify patterns that are characteristic of a “best customer.”
As time goes on, you can capture more and more of your customers’ unstructured data, which will allow you to ask more sophisticated questions about your customers. For example, you may want to know which races they run in, so you can sponsor those races. Or you may wonder what other running products they purchase, so you can figure out how to expand your product selection. Answers to each of these questions can help you connect with your customers and sell more products.
As you begin to work with data, realize that all types of data have value, whether structured, semi-structured, or unstructured. Part of your job is to figure out ways to extract value from data regardless of how structured or unstructured that data may be.
Data modeling is the process of defining the structure, flow, and relationships of data stored in a database management system (DBMS). A data model provides the framework for all the data an organization generates and stores, and it facilitates the process of extracting, combining, and analyzing that data later. The goal of the data modeling process is to define the following:
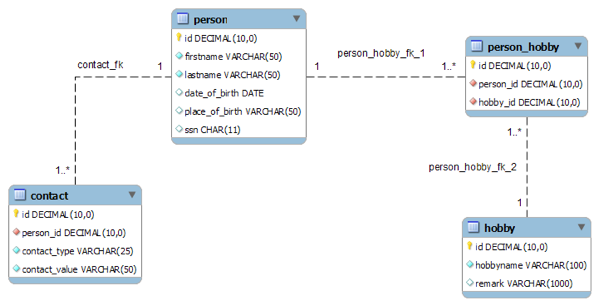
A simple example of a data model is a spreadsheet with customer contact information. Row and column headings label every data entry, and data validation can be used to constrain data; for example, you can limit text entries to a certain number of characters. In practice, however, data models are much more complex, typically consisting of hundreds of individual tables that are related to one another in various ways.
A data model ensures that an organization’s data is structured — meaning that all data entries are clearly labeled and in a consistent format. Structuring data ensures consistency in naming conventions, default values, and data entry formats.
To build a data model, data architects must work closely with everyone in the organization responsible for entering data into the system as well everyone who will be using the information system to extract data, conduct analysis, generate reports, and so on. Only the people who enter data into the system and use that data to develop and execute the organization’s strategy know what the data model must contain.
The process of developing a data model typically involves the following steps:
Additional steps are required to address access, storage, and performance requirements.
The data modeling process is broken down into three stages or levels:
Ideally, a data architect takes a top-down approach to data modeling — gathering input from people in various departments to develop a conceptual model for capturing data and storing it in the organization’s DBMS.
However, a data architect may also take a bottom-up approach, starting with existing forms, fields, software, and reports to reverse-engineer a data model from an organization’s existing system.
One of the key benefits of data modeling is that it helps to ensure data integrity — accuracy and reliability, both in terms of entity integrity and referential integrity:
Normalization is the process of systematically breaking down a large, complex table into smaller ones to eliminate disparities and redundancy, thus improving data integrity while making the DBMS easier to manage. For example, by creating separate tables for customer data and order data, if a customer moves to a new address, you simply make that change in the customer table, and the change is automatically reflected in any new orders the customer places. You don’t have to make the change in the customer table and the order table, which would require more work and more storage and be more susceptible to introducing data discrepancies in the system.
Of course, data modeling is much more complex and involved than what I describe here, but this post provides a basic understanding to get you started. Keep in mind, however, that not all data an organization needs is as structured as its internal data. For business intelligence, organizations often rely on semi-structured and unstructured data, a topic I will cover in a later post.